
Page 79 - IJB-7-3
P. 79
Pei, et al.
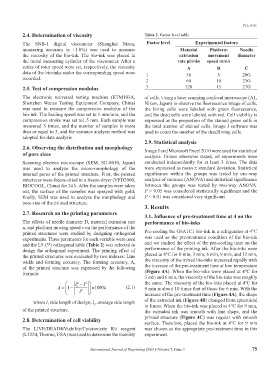
2.4. Determination of viscosity Table 2. Factor level table
The SNB-1 digital viscometer (Shanghai Nirun, Factor level Experimental factors
measuring accuracy is ±1.0%) was used to measure Material Platform Needle
the viscosity of the bio-ink. The bio-ink was placed in extrusion movement diameter
the metal measuring cylinder of the viscometer. After a rate μl/min speed mm/s
series of rotor speed were set, respectively, the viscosity A B C
data of the bio-inks under the corresponding speed were 1 30 5 20G
recorded. 2 60 10 23G
2.5. Test of compression modulus 3 120 15 27G
The electronic universal testing machine (ETM103A, of cells. Using a laser scanning confocal microscope (A1,
Shenzhen Wance Testing Equipment Company, China) Nikon, Japan) to observe the fluorescence image of cells,
was used to measure the compression modulus of the the living cells were labeled with green fluorescence,
bio-ink. The loading speed was set to 1 mm/min, and the and the dead cells were labeled with red. Cell viability is
compression stroke was set to1.5 mm. Each sample was expressed as the proportion of the stained green cells in
measured 3 times, and the number of samples is more the total number of stained cells. Image J software was
than or equal to 3, and the variance analysis method was used to count the number of the dead/living cells.
adopted for data analysis.
2.9. Statistical analysis
2.6. Observing the distribution and morphology
of pore sizes Image J and Microsoft Excel 2010 were used for statistical
analysis. Unless otherwise stated, all experiments were
Scanning electron microscope (SEM, SU-8010, Japan) conducted independently for at least 3 times. The data
was used to analyze the micro-morphology of the were expressed as mean ± standard deviation. Statistical
internal pores of the printed structure. First, the printed significance within the groups was tested by one-way
structures were freeze-dried in a freeze-dryer (VFD2000, analysis of variance (ANOVA) and statistical significance
BIOCOOL, China) for 24 h. After the samples were taken between the groups was tested by two-way ANOVA.
out, the surface of the samples was sprayed with gold; P < 0.05 was considered statistically significant and the
finally, SEM was used to analyze the morphology and P < 0.01 was considered very significant.
pore size of the printed structure.
3. Results
2.7. Research on the printing parameters 3.1. Influence of pre-treatment time at 4 on the
The effects of needle diameter D, material extrusion rate performance of bio-inks
u, and platform moving speed v on the performance of the
printed structures were studied by designing orthogonal Pre-cooling the G6A1C1 bio-ink in a refrigerator at 4°C
experiments. Three parameters for each variable were used was used as the pre-treatment condition of the bio-ink
and the L9 (3 ) orthogonal table (Table 2) was selected to and we studied the effect of the pre-cooling time on the
4
design the orthogonal experiment. The printing effect of performance of the printing ink. After the bio-inks were
the printed structures was evaluated by two indexes: Line placed at 4℃ for 0 min, 3 min, 6 min, 9 min, and 12 min,
width and forming accuracy. The forming accuracy, A, the viscosity of the mixed bio-inks increased rapidly with
of the printed structure was expressed by the following the increase of the pre-treatment time at low temperature
formula: (Figure 4A). When the bio-inks were placed at 4℃ for
3 min and 6 min, the viscosity of the bio-inks was roughly
l l the same. The viscosity of the bio-inks placed at 4℃ for
2
2
A 1 1 2 100% (2.1) 9 min is about 10 times that of those for 6 min. With the
l increase of the pre-treatment time (Figure 4A), the shape
where l, side length of design; l , average side length of the extruded ink (Figure 4B) changed from spheroidal
to linear. When the bio-ink was placed at 4℃ for 9 min,
1
of the printed structure. the extruded ink was smooth with line shape, and the
2.8. Determination of cell viability printed structure (Figure 4C) was regular with smooth
surface. Therefore, placed the bio-ink at 4℃ for 9 min
The LIVE/DEAD®Viability/Cytotoxicity Kit reagent was chosen as the appropriate pre-treatment time in this
(L3224, Thermo, USA) was used to determine the viability experiment.
International Journal of Bioprinting (2021)–Volume 7, Issue 3 75