
Page 81 - IJB-7-3
P. 81
Pei, et al.
A B
C D
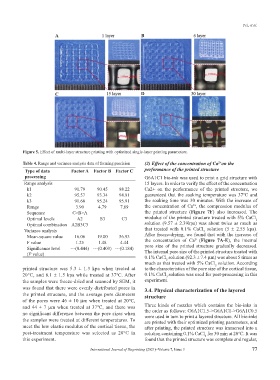
Figure 5. Effect of multi-layer structure printing with optimized single-layer printing parameters.
Table 4. Range and variance analysis data of forming precision (2) Effect of the concentration of Ca on the
2+
Type of data Factor A Factor B Factor C performance of the printed structure
processing G6A1C1 bio-ink was used to print a grid structure with
Range analysis 15 layers. In order to verify the effect of the concentration
k1 91.79 90.45 88.22 Ca2+ on the performance of the printed structure, we
k2 95.57 93.34 94.91 guaranteed that the soaking temperature was 37℃ and
k3 91.68 95.24 95.91 the soaking time was 30 minutes. With the increase of
2+
Range 3.90 4.79 7.69 the concentration of Ca , the compression modulus of
Sequence C>B>A the printed structure (Figure 7F) also increased. The
Optimal levels A2 B3 C3 modulus of the printed structure treated with 5% CaCl
2
Optimal combination A2B3C3 solution (9.57 ± 2.39kpa) was about twice as much as
Variance analysis that treated with 0.1% CaCl solution (5 ± 2.55 kpa).
2
Mean-square value 16.06 19.00 56.93 After freeze-drying, we found that with the increase of
2+
F value 1.25 1.48 4.44 the concentration of Ca (Figure 7A-E), the internal
Significance level ---(0.444) ---(0.403) ---(0.184) pore size of the printed structure gradually decreased.
(P value) The internal pore size of the printed structure treated with
0.1% CaCl solution (92.3 ± 7.4 μm) was about 5 times as
2
much as that treated with 5% CaCl solution. According
2
printed structure was 5.3 ± 1.3 kpa when treated at to the characteristics of the pore size of the cortical tissue,
20°C, and 8.1 ± 1.5 kpa while treated at 37℃. After 0.1% CaCl solution was used for post-processing in this
2
the samples were freeze-dried and scanned by SEM, it experiment.
was found that there were evenly distributed pores in 3.4. Physical characterization of the layered
the printed structure, and the average pore diameters structure
of the pores were 46 ± 10 μm when treated at 20℃,
and 44 ± 7 μm when treated at 37℃, and there was Three kinds of nozzles which contains the bio-inks in
no significant difference between the pore sizes when the order as follows: G6A1C1.5->G6A1C1->G6A1C0.5
were used in turn to print a layered structure. All bio-inks
the samples were treated at different temperatures. To are printed with their optimized printing parameters, and
meet the low elastic modulus of the cortical tissue, the after printing, the printed structure was immersed into a
post-treatment temperature was selected as 20°C in solution containing 0.1% CaCl for 30 min at 20℃. It was
2
this experiment. found that the printed structure was complete and regular,
International Journal of Bioprinting (2021)–Volume 7, Issue 3 77