
Page 83 - IJB-7-3
P. 83
Pei, et al.
A B
C D
E
F
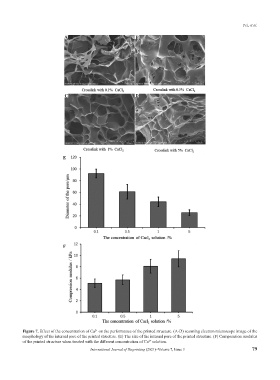
Figure 7. Effect of the concentration of Ca on the performance of the printed structure. (A-D) scanning electron microscope image of the
2+
morphology of the internal pore of the printed structure. (E) The size of the internal pore of the printed structure. (F) Compression modulus
of the printed structure when treated with the different concentration of Ca solution.
2+
International Journal of Bioprinting (2021)–Volume 7, Issue 3 79