
Page 111 - IJB-7-4
P. 111
Ye Li, et al.
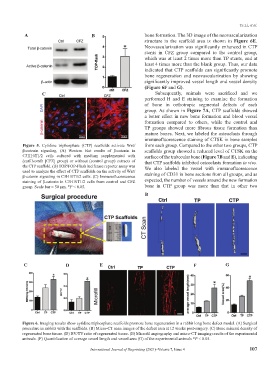
A B bone formation. The 3D image of the neovascularization
structure in the scaffold area is shown in Figure 6E.
Neovascularization was significantly enhanced in CTP
stents in CFZ group compared to the control group,
which was at least 2 times more than TP stents, and at
least 4 times more than the blank group. Thus, our data
indicated that CTP scaffolds can significantly promote
bone regeneration and neovascularization by showing
significantly improved vessel length and vessel density
(Figure 6F and G).
C Subsequently, animals were sacrificed and we
performed H and E staining to examine the formation
of bone in orthotropic segmental defects of each
group. As shown in Figure 7A, CTP scaffolds showed
a better effect in new bone formation and blood vessel
formation compared to others, while the control and
TP groups showed more fibrous tissue formation than
mature bones. Next, we labeled the osteoclasts through
immunofluorescence staining of CTSK in bone samples
Figure 5. Cytidine triphosphate (CTP) scaffolds activate Wnt/ from each group. Compared to the other two groups, CTP
β-catenin signaling. (A) Western blot results of β-catenin in scaffolds group showed a reduced level of CTSK on the
C3H10T1/2 cells cultured with medium supplemented with surface of the trabecular bone (Figure 7B and E), indicating
(carfilzomib [CFZ] group) or without (control group) extracts of that CTP scaffolds inhibited osteoclasts formation in vivo.
the CTP scaffold. (B) TOP/FOP-Flash luciferase reporter assay was We also labeled the vessel with immunofluorescence
used to analyze the effect of CTP scaffolds on the activity of Wnt/
β-catenin signaling in C3H10T1/2 cells. (C) Immunofluorescence staining of CD31 in bone sections from all groups, and as
staining of β-catenin in C3H10T1/2 cells from control and CFZ expected, the number of vessels around the new formation
group. Scale bar = 50 μm. *P < 0.05. bone in CTP group was more than that in other two
B
C D E F G
Figure 6. Imaging results show cytidine triphosphate scaffolds promote bone regeneration in a rabbit long bone defect model. (A) Surgical
procedure in rabbits with the scaffolds. (B) Micro-CT scan images of the defect area at 12 weeks post-surgery. (C) Bone mineral density of
regenerated bone tissue. (D) BV/TV ratio of regenerated tissue. (E) Microfil angiography and micro-CT imaging results of the experimental
animals. (F) Quantification of average vessel length and vessel area (G) of the experimental animals *P < 0.05.
International Journal of Bioprinting (2021)–Volume 7, Issue 4 107