
Page 168 - IJB-7-4
P. 168
3D Printing of Food Foams
inks less sticky and leads to a fall in adhesiveness and According to the framework, the food is considered safe
springiness. In absolute values, Ink 2B and Ink 4B had for consumption by dysphagic patients as long as the spoon
similar performance to Ink 1B. This suggests that the is visible after flicking, even though a thin food film may
XG added to EW foam increases printing performance. remain on the spoon . Most inks allow a large portion
[34]
Furthermore, the use of HPMC inks as a replacement of the inks to slide off the spoon, except Ink 5, suggesting
for EW foams does not significantly affect the textural that most inks would not stick to the oral cavity. Out of all
performance due to the similar texture profiles. the inks, Ink 2 had the best performance.
Considering that foams are to be consumed by
dysphagic patients as a safe way of hydration, IDDSI tests, 3.7. Demonstration of 3D-printed food foam
including the fork pressure test (Figure 6A) and the spoon Out of the three inks tested for textural properties, Inks
tilt test (Figure 6B), was carried out. These two tests were 2 and 4 had better printability. Both inks were used to
recommended test in the IDDSI framework for food of print various 3D structures. The structures were created
level 4-5 (pureed, minced, and moist). The results are without overhang or with only small overhang due to
shown in Figure 6. The fork pressure tests food hardness. the lack of support. The four structures printed were an
Inks 2, 4, and 5 show a clear indent pattern, suggesting octopus, lobster, turtle, and hammerhead shark, as shown
that they are soft enough to be consumed by dysphagic in Figure 7.
patients. For the spoon tilt test, the spoon was tilted and The lighter Ink 4 provided better and smoother
flicked once to check if the inks slid off the spoon. It is prints than Ink 2, (Figures 7A and B), with the octopus
used to determine the adhesiveness and cohesiveness. head bearing clunks and a smooth spherical shape as
A B
D
C
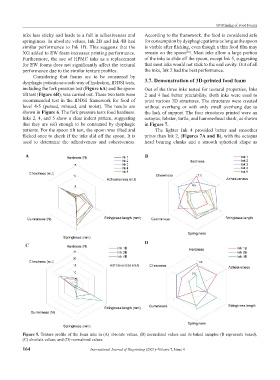
Figure 5. Texture profile of the foam inks in (A) absolute values, (B) normalized values and its baked samples (B represents baked),
(C) absolute values, and (D) normalized values.
164 International Journal of Bioprinting (2021)–Volume 7, Issue 4