
Page 129 - IJB-8-1
P. 129
Yang, et al.
Figure 2. Schematic of porous Ta metallographic sample preparation.
186 GPa and a Poisson’s ratio of 0.35 . The boundary
[29]
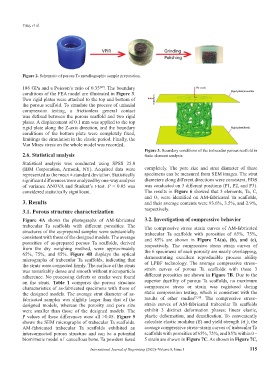
conditions of the FEA model are illustrated in Figure 3.
Two rigid plates were attached to the top and bottom of
the porous scaffold. To simulate the process of uniaxial
compression testing, a frictionless general contact
was defined between the porous scaffold and two rigid
plates. A displacement of 0.1 mm was applied to the top
rigid plate along the Z-axis direction, and the boundary
conditions of the bottom plate were completely fixed,
limitings the simulation in the elastic period. Finally, the
Von Mises stress on the whole model was recorded.
Figure 3. Boundary conditions of the trabecular porous scaffold in
2.6. Statistical analysis finite element analysis.
Statistical analysis was conducted using SPSS 25.0
(IBM Corporation, Armonk, NY). Acquired data were completely. The pore size and strut diameter of these
represented as the mean ± standard deviation. Statistically specimens can be measured from SEM images. The strut
significant differences were analyzed by one-way analysis diameters along different directions were consistent. EDS
of variance ANOVA and Student’s t-test. P < 0.05 was was conducted on 3 different positions (P1, P2, and P3).
considered statistically significant. The results in Figure 6 showed that 3 elements, Ta, C,
and O, were identified on AM-fabricated Ta scaffolds,
3. Results and their average contents were 93.6%, 3.5%, and 2.9%,
3.1. Porous structure characterization respectively.
Figure 4A shows the photographs of AM-fabricated 3.2. Investigation of compressive behavior
trabecular Ta scaffolds with different porosities. The The compressive stress–strain curves of AM-fabricated
structures of the as-prepared samples were substantially trabecular Ta scaffolds with porosities of 65%, 75%,
consistent with those of the designed models. The average and 85% are shown in Figure 7A(a), (b), and (c),
porosities of as-prepared porous Ta scaffolds, derived respectively. The compressive stress–strain curves of
from the dry weighing method, were approximately the 6 specimens of each porosity are nearly overlapping,
65%, 75%, and 85%. Figure 4B displays the optical demonstrating excellent reproducible process ability
micrographs of trabecular Ta scaffolds, indicating that
the struts were connected firmly. The surface of the struts of LPBF technology. The average compressive stress–
was remarkably dense and smooth without microparticle strain curves of porous Ta scaffolds with these 3
adherence. No processing defects or cracks were found different porosities are shown in Figure 7B. Due to the
on the struts. Table 1 compares the porous structure superior ductility of porous Ta scaffolds, no maximum
characteristics of as-fabricated specimens with those of compressive stress or strain was registered during
the designed models. The average strut diameter of as- static compression testing, which is consistent with the
fabricated samples was slightly larger than that of the results of other studies [5,30] . The compressive stress–
designed models, whereas the porosity and pore size strain curves of AM-fabricated trabecular Ta scaffolds
were smaller than those of the designed models. The exhibit 3 distinct deformation phases: linear elastic,
P values of these differences were all >0.05. Figure 5 plastic deformation, and densification. To conveniently
shows the SEM micrographs of trabecular Ta scaffolds. calculate elastic modulus (E) and yield strength (σ ), the
y
AM-fabricated trabecular Ta scaffolds exhibited an average compressive stress–strain curves of trabecular Ta
interconnected porous structure and can be a potential scaffolds with porosities of 65%, 75%, and 85% within 0 –
biomimetic model of cancellous bone. Ta powders fused 5 strain are shown in Figure 7C. As shown in Figure 7C,
International Journal of Bioprinting (2022)–Volume 8, Issue 1 115