
Page 131 - IJB-8-1
P. 131
Yang, et al.
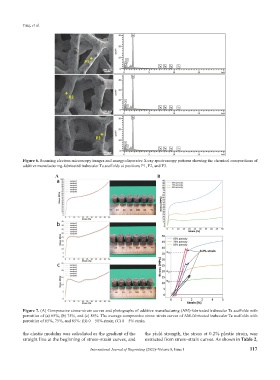
Figure 6. Scanning electron microscopy images and energy-dispersive X-ray spectroscopy patterns showing the chemical compositions of
additive manufacturing-fabricated trabecular Ta scaffolds at positions P1, P2, and P3.
A B
Figure 7. (A) Compressive stress–strain curves and photographs of additive manufacturing (AM)-fabricated trabecular Ta scaffolds with
porosities of (a) 65%, (b) 75%, and (c) 85%. The average compressive stress–strain curves of AM-fabricated trabecular Ta scaffolds with
porosities of 65%, 75%, and 85%: (B) 0 – 50% strain; (C) 0 – 5% strain.
the elastic modulus was calculated as the gradient of the the yield strength, the stress at 0.2% plastic strain, was
straight line at the beginning of stress–strain curves, and extracted from stress–strain curves. As shown in Table 2,
International Journal of Bioprinting (2022)–Volume 8, Issue 1 117