
Page 133 - IJB-8-1
P. 133
Yang, et al.
due to limited compressive strain. Three representative the annealed specimen (d ). Both fractures occurred at
2
collapse characterizations on the polished cross sections the joints of struts despite their different fracture sites.
of metallographic specimens for each porosity group Similarly, a bigger fracture at position e was observed
were chosen to collect EBSD micrographs. For trabecular on the unannealed specimen (e ) than that observed on
3
Ta scaffolds with porosity of 65% (Figure 12), fractures the annealed specimen (e ). An obvious fracture at the
2
occurred at positions a and b of unannealed specimens joints of struts was found at position f of the unannealed
(a and b ), whereas no deformation or fracture was specimen (f ), whereas no deformation or fracture was
3
3
3
found on annealed specimens at the same position (a found on the annealed specimen at the same position
2
and b ). Identical fractures were observed at positions (f ). For trabecular Ta scaffolds with porosity of 85%
2
2
c of both annealed and unannealed specimens (c and (Figure 14), fractures occurred at the positions k, m, and
2
c ). For trabecular Ta scaffolds with porosity of 75% n of either annealed or unannealed specimens (k , m ,
3
2
3
(Figure 13), a bigger fracture at position d was observed m , n , and n ), except for the position k of the annealed
2
3
on the unannealed specimen (d ) than that observed on specimen (k ).
3
3
2
3.4. FEA
Figure 15 displays the FEA results of trabecular Ta
scaffolds with porosities of 65%, 75%, and 85% within the
range of linear elastic deformation. The red color indicates
stress concentration in the scaffolds, indicating that more
deformation or fracture has occurred in these areas. From
the stress distribution diagram, the stress of trabecular
Ta scaffolds under uniaxial compressive loading mainly
concentrates at the junctions of struts, which is consistent
with the results of compressive experiments. Stress
Figure 9. Stress–strain curve and the failed specimen of the distribution inside the trabecular Ta scaffold is illustrated
[36]
trabecular Ti6Al4V scaffold (from ref. licensed under Creative in the longitudinal section view of the FEA model. Under
Commons Attribution license). uniaxial compressive loading, trabecular Ta scaffolds can
A
B
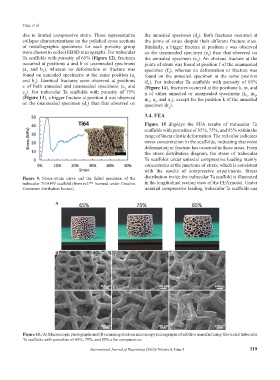
Figure 10. (A) Macroscopic photographs and (B) scanning electron microscopy micrographs of additive manufacturing-fabricated trabecular
Ta scaffolds with porosities of 65%, 75%, and 85% after compression.
International Journal of Bioprinting (2022)–Volume 8, Issue 1 119