
Page 183 - IJB-8-1
P. 183
Yao, et al.
be entangled with mask style as the output of this AD-GAN procedure, two key steps, i.e., CLSM image collection and
model, that is, nuclei segmentation results. Meanwhile, nuclei segmentation are described as follows.
spatial structure (the shape and position information of
nuclei) is preserved with content consistency during this 2.1. CLSM image collection from fibrous
image-to-mask translation. scaffold-based cell culture
The overall flow of this paper is organized as follows.
The relevant methods are discussed in Section 2, including CLSM images collected from three types of fibrous
CLSM image collection in fibrous scaffold-based cell scaffolds are utilized for cell segmentation study:
culture, overview of AD-GAN, its training strategy Poly-E-caprolactone (PCL) scaffolds and two types
and loss function. Section 3 covers the performance of surface engineered nanoporous scaffolds, namely,
[21]
comparison of the segmentation methods including AD- PCL-10-D and PCL-20-D . The schematic diagram
GAN, CycleGAN, Squassh, and CellProfiler under low/ of scaffold with fiber stacking structure is shown in
high cell density or cross cell lines. Cell adhesion and (Figure 3A), the scanning electron microscope (SEM)
proliferation analysis based on the segmentation results image of the overall fibrous PCL scaffold structure is
are reported in Section 4. Finally, the conclusion and shown in (Figure 3B), and the cross-section of fiber
future work are set out in Section 5. stacking is shown in (Figure 3C). It can be seen that
the pores of the scaffold are uniformly distributed within
2. Methods the structure, and fibers are well oriented and orderly
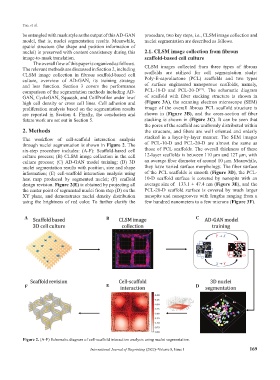
The workflow of cell-scaffold interaction analysis stacked in a layer-by-layer manner. The SEM images
through nuclei segmentation is shown in Figure 2. The of PCL-10-D and PCL-20-D are almost the same as
six-step procedure includes: (A-F): Scaffold-based cell those of PCL scaffolds. The overall thickness of these
culture process; (B) CLSM image collection in the cell 12-layer scaffolds is between 110 µm and 127 µm, with
culture process; (C) AD-GAN model training; (D) 3D an average fiber diameter of around 10 µm. Meanwhile,
nuclei segmentation results with position, size and shape they have varied surface morphology. The fiber surface
information; (E) cell-scaffold interaction analysis using of the PCL scaffolds is smooth (Figure 3D), the PCL-
heat map produced by segmented nuclei; (F) scaffold 10-D scaffold surface is covered by nanopits with an
design revision. Figure 2(E) is obtained by projecting all average size of 133.1 ± 47.4 nm (Figure 3E), and the
the center point of segmented nuclei from step (D) on the PCL-20-D scaffold surface is covered by much larger
XY plane, and demonstrates nuclei density distribution nanopits and nanogrooves with lengths ranging from a
using the brightness of red color. To further clarify the few hundred nanometers to a few microns (Figure 3F).
A B C
F E D
Figure 2. (A-F) Schematic diagram of cell-scaffold interaction analysis using nuclei segmentation.
International Journal of Bioprinting (2022)–Volume 8, Issue 1 169