
Page 187 - IJB-8-1
P. 187
Yao, et al.
Original CellProfiler Squassh CycleGAN AD-GAN
8 µm
24 µm
40 µm
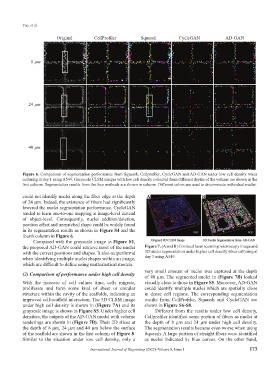
Figure 6. Comparison of segmentation performance from Squassh, Cellprofiler, CycleGAN and AD-GAN under low cell density when
culturing at day 1 using A549. Grayscale CLSM images with low cell density collected from different depths of the volume are shown in the
first column. Segmentation results from the four methods are shown in column. Different colors are used to discriminate individual nuclei.
could not identify nuclei along the fiber edge at the depth A B
of 24 µm. Indeed, the existence of fibers had significantly
lowered the nuclei segmentation performance. CycleGAN
tended to learn one-to-one mapping at image-level instead
of object-level. Consequently, nuclei addition/deletion,
position offset and unmatched shape could be widely found
in its segmentation results as shown in Figure S4 and the
fourth column in Figure 6.
Compared with the grayscale image in Figure S1,
the proposed AD-GAN could retrieve most of the nuclei Figure 7. (A and B) Confocal laser scanning microscopy image and
with the correct positions and shapes. It also outperformd 3D nuclei segmentation under higher cell density when culturing at
when identifying multiple nuclei shapes within an image, day 3 using A549.
which are difficult to define using mathematical models.
very small amount of nuclei was captured at the depth
(2) Comparison of performance under high cell density
of 40 µm. The segmented nuclei in (Figure 7B) looked
With the increase of cell culture time, cells migrate, visually close to those in Figure S5. Moreover, AD-GAN
proliferate and form some kind of sheet or circular could identify multiple nuclei which are spatially close
structure within the cavity of the scaffolds, indicating an in dense cell regions. The corresponding segmentation
improved cell-scaffold interaction. The 3D CLSM image results from CellProfiler, Squassh and CycleGAN are
under high cell density is shown in (Figure 7A) and its shown in Figure S6-S8.
grayscale image is shown in Figure S5. Under higher cell Different from the results under low cell density,
densities, the outputs of the AD-GAN model with volume Cellprofiler identified some portion of fibers as nuclei at
renderings are shown in (Figure 7B). Their 2D slices at the depth of 8 µm and 24 µm under high cell density.
the depth of 8 µm, 24 µm and 40 µm below the surface The segmentation results became even worse when using
of the scaffold are shown in the first column of Figure 8. Squassh. A large portion of straight fibers were identified
Similar to the situation under low cell density, only a as nuclei indicated by blue curves. On the other hand,
International Journal of Bioprinting (2022)–Volume 8, Issue 1 173