
Page 188 - IJB-8-1
P. 188
Analyzing Cell-Scaffold Interaction through Unsupervised 3D Nuclei Segmentation
Original CellProfiler Squassh CycleGAN AD-GAN
8 µm
24 µm
40 µm
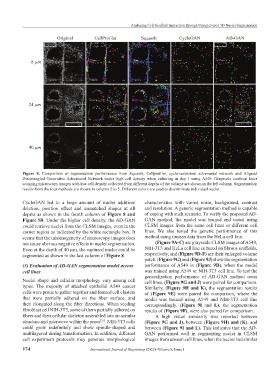
Figure 8. Comparison of segmentation performance from Squassh, Cellprofiler, cycle-consistent adversarial network and Aligned
Disentangled Generative Adversarial Network under high cell density when culturing at day 1 using A549. Grayscale confocal laser
scanning microscopy images with low cell density collected from different depths of the volume are shown in the left column. Segmentation
results from the four methods are shown in column 2 to 5. Different colors are used to discriminate individual nuclei.
CycleGAN led to a large amount of nuclei addition/ characteristics with varied noise, background, contrast
deletion, position offset and unmatched shapes at all and resolution. A generic segmentation method is capable
depths as shown in the fourth column of Figure 8 and of coping with such scenario. To verify the proposed AD-
Figure S8. Under the higher cell density, the AD-GAN GAN method, the model was trained and tested using
could retrieve nuclei from the CLSM images, even in the CLSM images from the same cell lines or different cell
corner region as indicated by the white rectangle box. It lines. We also tested the generic performance of this
seems that the inhomogeneity of microscopy images does method using unseen data from the HeLa cell line.
not cause obvious negative effects in nuclei segmentation. (Figure 9A-C) are grayscale CLSM images of A549,
Even at the depth of 40 µm, the captured nuclei could be NIH-3T3 and HeLa cell line cultured on fibrous scaffolds,
segmented as shown in the last column of Figure 8. respectively, and (Figure 9D-F) are their enlarged volume
patch. (Figure 9G) and (Figure 9J) show the segmentation
(3) Evaluation of AD-GAN segmentation model across performance of A549 in (Figure 9D), when the model
cell lines was trained using A549 or NIH-3T3 cell line. To test the
generalization performance of AD-GAN method cross
Nuclei shape and cellular morphology vary among cell cell lines, (Figure 9G and J) were paired for comparison.
types. The majority of attached epithelial A549 cancer Similarly, (Figure 9H and K), the segmentation results
cells were prone to gather together and formed cell clusters of (Figure 9E) were paired for comparison, where the
that were partially adhered on the fiber surface, and model was trained using A549 and NIH-3T3 cell line
then elongated along the fiber directions. When seeding correspondingly. (Figure 9I and L), the segmentation
fibroblast cell NIH-3T3, some of them partially adhered on results of (Figure 9F), were also paired for comparison.
fibers and their cellular skeleton assembled into an annular A high visual similarity was reported between
structure and interwove within the pores . NIH-3T3 cells (Figure 9G and J), between (Figure 9H) and (K), and
[21]
could grow indefinitely and show spindle-shaped and between (Figure 9I and L). This indicates that the AD-
multilayered during transformation. In addition, different GAN performed well in segmenting nuclei in CLSM
cell experiment protocols may generate morphological images from unseen cell lines, when the nuclei had similar
174 International Journal of Bioprinting (2022)–Volume 8, Issue 1