
Page 190 - IJB-8-1
P. 190
Analyzing Cell-Scaffold Interaction through Unsupervised 3D Nuclei Segmentation
where N , N , and N are defined as the number of true- The visualization of a HaCaT raw image, the
FN
TP
FP
positive segmented samples, false-positive segmented corresponding ground truth and the prediction of AD-
samples (voxels wrongly detected as nuclei), and false- GAN are shown in Figure 10. As reported by Kromp
negative segmented samples (voxels wrongly detected et al. , the biological experts obtained DICE 93.2%
[28]
as background), respectively. For example, wrongly and annotation experts obtained DICE (89.2%) when
identified nuclei may increase N , and nuclei with poor annotating this dataset. As an unsupervised method,
FP
staining may lead to the increase of N . In general, larger our AD-GAN achieved precision 85.4%, recall 95.2%
FN
precision and recall indicate accurate segmentation, and DICE 89.3%, which are close to the human expert
and larger DICE indicates better similarity between the recognition capability. Hence, we can conclude the
ground truth and the segmentation results. proposed AD-GAN can replace manual annotation with
The quantitative evaluation results among the performance similar to human experts.
different segmentation methods are listed in Table 1
based on the fully annotated testing dataset. We believe 4. Cell adhesion and proliferation analysis
the size and diversity of this dataset is sufficient to reflect using segmented nuclei
the performance of different segmentation models. As
shown in Table 1, CellProfiler achieved the highest Researchers have reported that the cell adhesion,
recall (91.3%), but the poorest precision (37.5%). This is proliferation and migration heavily depend on scaffold
because the shadow regions along Z axis were detected pore size, surface morphology, biomaterials and internal
[29]
as the nuclei. Squassh also achieved good recall but structure . The cell attachment rate lowers with
low precision, since the segmented objects consisted increasing pore size, while relatively larger pore size may
[30]
of connected nuclei or fibers. A takeaway from this is improve cell migration and proliferation . Meanwhile,
that Squassh or CellProfiler generally suffers from low the preferred pore size is highly cell-dependent.
performance in analyzing CLSM images consisting Pore sizes of 30 – 80 µm were reported as an optimal
of scaffold fibers. Besides, hours of effort in image choice for endothelial cell adhesion in porous silicon
preprocessing and parameter setting cannot improve their nitride scaffolds, but fibroblasts usually preferred larger
global segmentation performance. pores . In an effort to reconcile the conflicting reports,
[31]
The DICE of CycleGAN was only 47.0%, due to it is important to evaluate cell-scaffold interaction with
the inconsistent mapping of nuclei between the CLSM convincing evidence.
image and synthetic mask. With the minimum effort Besides, multiple factors are involved in scaffold
on parameter tuning, our AD-GAN method performed design such as material composition, surface roughness
well with precision (89%), accuracy (78.2%) and DICE and internal structures. To clarify their influences on cell
(83.3%), reflecting its better capability in identifying culture, automated nuclei segmentation is a prerequisite,
nuclei in CLSM images. Moreover, the majority of the which is particularly pronounced in the stage of scaffold
identified nuclei are true-positive samples. design. Consequently, the information of nuclei number,
size and position can be collected to analyze scaffold
3.3. Segmentation performance in 2D CLSM design. In this study, we used segmented nuclei from 3D
images CLSM images to explore how scaffold properties can
Our AD-GAN method can also be applied to segment modulate cell adhesion, proliferation and migration in a
nuclei in 2D CLSM images by replacing the 3D computational manner. This provides a rapid screening
convolutional layers with 2D. This is tested using the method to analyze cell-scaffold interaction.
recently released public dataset HaCaT . This dataset 4.1. A549 cell adhesion and proliferation analysis
[28]
with highly over-lapping nuclei and partially invisible
borders had been annotated by biological and annotation Figure 11A and B demonstrate CLSM images of A549
experts. It consists of 26 training images and 15 test cell cultured on PCL-10-D scaffold on day 1 and 3.
images with human keratinocyte cell line. The positions and size information were identified and
plotted using black dots as the heatmap, as shown in
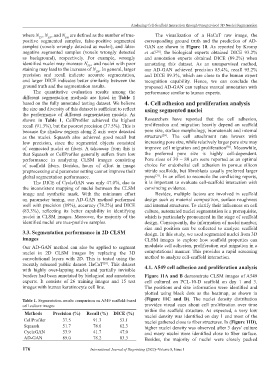
Table 1. Segmentation results comparison on A549 scaffold-based (Figure 11C and D). The nuclei density distribution
cell culture images provides visual cues about cell proliferation over time
Methods Precision (%) Recall (%) DICE (%) within the scaffold structure. As expected, a very low
CellProfiler 37.5 91.3 53.1 nuclei density was identified on day 1 and most of the
nuclei gathered close to fiber structures. In (Figure 11D),
Squassh 51.7 78.6 62.3 higher nuclei density was observed after 3 days’ culture
CycleGAN 53.9 41.7 47.0 and many nuclei were identified close to fiber surface.
AD-GAN 89.0 78.2 83.3 Besides, the majority of nuclei were closely packed
176 International Journal of Bioprinting (2022)–Volume 8, Issue 1