
Page 191 - IJB-8-1
P. 191
Yao, et al.
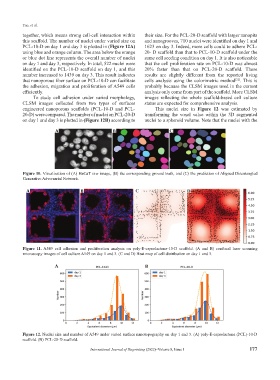
together, which means strong cell-cell interaction within their size. For the PCL-20-D scaffold with larger nanopits
this scaffold. The number of nuclei under varied size on and nanogrooves, 710 nuclei were identified on day 1 and
PCL-10-D on day 1 and day 3 is plotted in (Figure 12A) 1623 on day 3. Indeed, more cells could to adhere PCL-
using blue and orange column. The area below the orange 20- D scaffold than that to PCL-10-D scaffold under the
or blue dot line represents the overall number of nuclei same cell seeding condition on day 1. It is also noticeable
on day 1 and day 3, respectively. In total, 522 nuclei were that the cell proliferation rate on PCL-10-D was almost
identified on the PCL-10-D scaffold on day 1, and this 20% faster than that on PCL-20-D scaffold. These
number increased to 1439 on day 3. This result indicates results are slightly different from the reported living
that nanoporous fiber surface on PCL-10-D can facilitate cells analysis using the colorimetric method . This is
[32]
the adhesion, migration and proliferation of A549 cells probably because the CLSM images used in the current
efficiently. analysis only come from part of the scaffold. More CLSM
To study cell adhesion under varied morphology, images reflecting the whole scaffold-based cell culture
CLSM images collected from two types of surfaces status are expected for comprehensive analysis.
engineered nanoporous scaffolds (PCL-10-D and PCL- This nuclei size in Figure 12 was estimated by
20-D) were compared. The number of nuclei on PCL-20-D transforming the voxel value within the 3D segmented
on day 1 and day 3 is plotted in (Figure 12B) according to nuclei to a spheroid volume. Note that the nuclei with the
A B C
Figure 10. Visualization of (A) HaCaT raw image, (B) the corresponding ground truth, and (C) the prediction of Aligned Disentangled
Generative Adversarial Network.
A B C D
Figure 11. A549 cell adhesion and proliferation analysis on poly-E-caprolactone-10-D scaffold. (A and B) confocal laser scanning
microscopy images of cell culture A549 on day 1 and 3. (C and D) Heat map of cell distribution on day 1 and 3.
A B
Figure 12. Nuclei size and number of A549 under varied surface nanotopography on day 1 and 3. (A) poly-E-caprolactone (PCL)-10-D
scaffold. (B) PCL-20-D scaffold.
International Journal of Bioprinting (2022)–Volume 8, Issue 1 177