
Page 189 - IJB-8-1
P. 189
Yao, et al.
A D G J
B E H K
C F I L
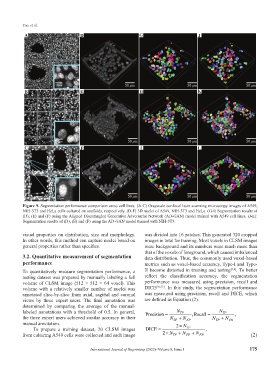
Figure 9. Segmentation performance comparison cross cell lines. (A-C) Grayscale confocal laser scanning microscopy images of A549,
NIH-3T3 and HeLa cells cultured on scaffolds, respectively. (D-F) 3D nuclei of A549, NIH-3T3 and HeLa. (G-I) Segmentation results of
(D), (E) and (F) using the Aligned Disentangled Generative Adversarial Network (AD-GAN) model trained with A549 cell lines. (J-L):
Segmentation results of (D), (E) and (F) using the AD-GAN model trained with NIH-3T3.
visual properties on distribution, size and morphology. was divided into 16 patches. This generated 320 cropped
In other words, this method can capture nuclei based on images in total for training. Most voxels in CLSM images
general properties rather than specifics. were background and its numbers were much more than
that of the voxels of foreground, which caused imbalanced
3.2. Quantitative measurement of segmentation data distribution. Thus, the commonly used voxel-based
performance metrics such as voxel-based accuracy, Type-I and Type-
To quantitatively measure segmentation performance, a II become distorted in training and testing [3,4] . To better
testing dataset was prepared by manually labeling a full reflect the classification accuracy, the segmentation
volume of CLSM image (512 × 512 × 64 voxel). This performance was measured using precision, recall and
volume with a relatively smaller number of nuclei was DICE [26,27] . In this study, the segmentation performance
annotated slice-by-slice from axial, sagittal and coronal was measured using precision, recall and DICE, which
views by three expert users. The final annotation was are defined as Equation (2).
determined by comparing the average of the manual-
labeled annotations with a threshold of 0.5. In general, Precision = N TP Recall = N TP
the three expert users achieved similar accuracy in their N TP + N FP , N TP + N FN ,
manual annotation. 2× N
To prepare a training dataset, 20 CLSM images DICE = TP ,
from culturing A549 cells were collected and each image 2× N TP + N FP + + N FN (2)
International Journal of Bioprinting (2022)–Volume 8, Issue 1 175