
Page 68 - IJB-8-1
P. 68
AJ P of Bioelectrical Devices
®
(Hirox KH – 8700) was used to inspect the quality and is critical for precise and high-resolution printing. In the
geometry of the printed features. manual approach, the quality response, q, was evaluated
according to a line quality rank, as reported in Table 2.
(1) Print quality This protocol was tested, fine-tuned, and verified by
The line quality is a useful factor to determine whether five operators. In the automated procedure, the images
the printed pattern is acceptable both in terms of shape were processed using a MatLab tool that analytically
accuracy and fidelity. It also helps to systematically determines the mean and the standard deviation (σw
l
explore the suitable process window for the desired and σwo) of the line (w ) and the overspray (w ) width
l
0
purpose. The evaluation of the line quality is far from (Figure 2A). Using these quantities, the line quality, q ,
a
being trivial and several ways have been proposed in the can be defined as:
literature [22-24] . In this paper, a combined manual (visual w w
inspection and operator’s rank (q)) and automated (image q = a u × 1 l + u × 2 l + u 3 (1)
processing through MatLab program (q )) approach w + l w o w + l w l
a
is presented to evaluate the line quality. In both cases, In particular, the optimal value of the variables (u ,
images of the printed lines were acquired through optical u , u ) is found by solving a least square problem, given
1
microscopy (Hirox KH – 8700). In this context, a good by: 3
2
quality printed line is intended as a dense and well-defined min || q − q || (2)
track with straight edges and (almost) null overspray (i.e., uu 2 3 a 2
1 , ,u
scattered material, in the form of printed drops, deposited The image processing procedure is composed of
in the proximity of the line edges). Porous and sputtered three main steps. First, the image contrast is enhanced
lines are indeed difficult to control over shape and are not to evidence the overspray and the line borders
electrically functional. A reduction in the overspray also (Figure 2B and C). Then the line length is divided
prevents wastage of ink, which is in most of the cases into k = 13 pieces (Figure 2D); for each of them, the
very precious and expensive. Moreover, line straightness minimal of the grayscale levels, corresponding to
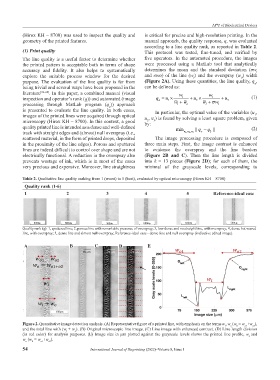
Table 2. Qualitative line quality ranking from 1 (worst) to 5 (best), evaluated by optical microscopy (Hirox KH – 8700)
Quality rank (1‑6)
1 2 3 4 5 Reference‑ideal case
Quality rank (q): 1, sputtered line; 2, porous line with remarkable presence of overspray; 3, low dense and no straight line, with overspray; 4, dense but waved
line, with overspray; 5, dense line and almost null overspray; Reference-ideal case - dense line and null overspray (indicative edited image).
A B C D E
Figure 2. Quantitative image detection analysis. (A) Representative figure of a printed line, with emphasis on the terms w , w (w = w +w ),
0
o
o2
o1
l
and the total line with (w + w ). (B) Original microscopic line image. (C) Line image with enhanced contrast. (D) Line length division
l
o
(in red color) for analysis purposes. (E) Image size in µm plotted against the grayscale levels shows the printed line profile, w and
l
w (w = w +w ).
o 0 o1 o2
54 International Journal of Bioprinting (2022)–Volume 8, Issue 1