
Page 73 - IJB-8-1
P. 73
Seiti, et al.
thin printed lines, while A has more likely effect on the A
kinetic energy and density of the aerosol beam. Hence, at
low carrier gas flows, the aerosol will probably contain
insufficient material to print dense features, while highly
dense and energetic beams require large amount of sheet
gas to be adequately focused. Secondly, a shrinkage of
the PEDOT: PSS ink upon deposition was identified
significant when T = 60°C. This phenomenon is typically
related to the ink composition. The ink used is indeed a
mixed water-based solution with DEG as drying control
agent (namely, co-solvent), at a low concentration of
12 – 20 wt%. In particular, DEG is known to possess a
high boiling point and vapor pressure, and low surface
tension. When the aerosolized ink impinges on the heated B
substrate at T = 60°C, water evaporation is quickly
enhanced, triggering a preliminary curing process,
which starts from the surface of the deposited droplet of
material. A convective flow toward the droplet center is
then created (counter-clockwise Marangoni effect ),
[34]
typically resulting in the formation of a thin line, with
curled/waved edges at low A (q ≤ 3), and with cringed,
dried-like surfaces at high A, despite straight edges (q ≥ 4).
Based on these observations, a flow rate of A = 40 sccm
was chosen to speed the printing process, and a platen
temperature, T, of 40°C was selected to allow for the
coalescence of the printed wet layers. The combination
of printed parameters A40-S40 and A40-S80 were finally
designated and put forward for the next investigation.
The trend variations were then verified via additional C
tests conducted outside the initial process window and on
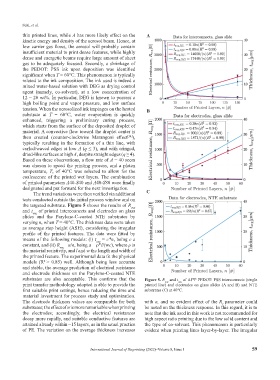
the targeted substrate. Figure 5 shows the results of R avg
and t of printed interconnects and electrodes on glass
avg
slides and the Parylene-C-coated NTE substrates by
varying n, when T = 40°C. The thickness data were taken
as average step height (ASH), considering the irregular
profile of the printed features. The data were fitted by
means of the following models: (i) t = c*n, being c a
avg
constant, and (ii) R =a/n, being a = ρ*l/(wc), where ρ is
avg
the material resistivity, and l and w the length and width of
the printed feature. The experimental data fit the physical
models (R > 0.85) well. Although being less accurate
2
and stable, the average prediction of electrical resistance
and electrode thickness on the Parylene-C-coated NTE
substrates are also acceptable. This confirms that the Figure 5. R and t of AJ P PEDOT: PSS interconnects (single
®
avg
avg
print transfer methodology adopted is able to provide the printed line) and electrodes on glass slides (A and B) and NTE
first suitable print settings, hence reducing the time and substrates (C) at 40°C.
material investment for process study and optimization.
The electrode thickness values are comparable for both with n, and no evident effect of the R parameter could
f
substrates; the effect of n is more remarkable when printing be noted on the thickness response. In this regard, it is to
the electrodes; accordingly, the electrical resistances note that the ink used in this work is not recommended for
decay more rapidly, and suitable conductive features are high aspect ratio printing due to the low solid content and
attained already within ~15 layers, as in the usual practice the type of co-solvent. This phenomenon is particularly
of PE. The variation on the average thickness increases evident when printing lines layer-by-layer. The irregular
International Journal of Bioprinting (2022)–Volume 8, Issue 1 59