
Page 72 - IJB-8-1
P. 72
AJ P of Bioelectrical Devices
®
focuses on the AJ P printing process of the circuit (light A
®
blue color) around the micro-patterned channels on the
NTE substrate. Profilometer analyses of the printed
electrical patterns (three repetitions) were performed by
means of a DektakXT Stylus Profiler (Bruker, USA). The
electrical impedance of the printed device was measured
in PBS (Sigma Aldrich, BE) at a concentration of 10× and
pH 7.4, using Potentiostat Gamry Reference 600 (Gamry
Instruments, USA) (three repetitions). A 100 mV AC
voltage was applied in the frequency range 1 – 5 × 10 Hz,
6
with a delayed time of 10 s.
3. Results and discussion
3.1. Process investigation
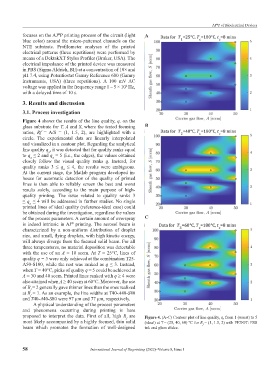
Figure 4 shows the results of the line quality, q, on the
glass substrate for T, A and S, where the tested focusing B
ratios, Rf = A/S = (1, 1.5, 2), are highlighted with a
circle. The experimental data are linearly interpolated
and visualized in a contour plot. Regarding the analytical
line quality q , it was detected that for quality ranks equal
a
to q ≤ 2 and q = 5 (i.e., the edges), the values obtained
a
a
closely follow the visual quality ranks q. Instead, for
quality ranks 3 ≤ q ≤ 4, the results were ambiguous.
a
At the current stage, the Matlab program developed in-
house for automatic detection of the quality of printed
lines is then able to reliably screen the best and worst
results solely, according to the main purpose of high-
quality printing. The issue related to quality ranks 3
≤ q ≤ 4 will be addressed in further studies. No single
a
printed lines of ideal quality (reference-ideal case) could
be obtained during the investigation, regardless the values
of the process parameters. A certain amount of overspray C
is indeed intrinsic in AJ printing. The aerosol beam is
®
characterized by a non-uniform distribution of droplet
size, and small, flying droplets, with high kinetic energy,
will always diverge from the focused solid beam. For all
three temperatures, no material deposition was detectable
with the use of an A = 10 sccm. At T = 25°C, lines of
quality q = 5 were only achieved at the combination T25-
A50-S100, while the rest was ranked as q ≤ 3. Instead,
when T = 40°C, picks of quality q = 5 could be achieved at
A = 30 and 40 sccm. Printed lines ranked with q ≥ 4 were
also attained when A ≥ 40 sccm at 60°C. Moreover, the use
of R = 2 generally gave thinner lines than the ones realized
f
at R = 1. As an example, the line widths at T40-A40-S40
f
and T40-A40-S80 were 97 μm and 77 μm, respectively.
A physical understanding of the process parameters
and phenomena occurring during printing is here
proposed to interpret the data. First of all, high R are Figure 4. (A-C) Contour plot of line quality, q, from 1 (worst) to 5
f
most likely accompanied by a highly focused, thin solid (ideal) at T= (25, 40, 60) °C for R = (1, 1.5, 2) with PEDOT: PSS
f
beam which promotes the formation of well-designed ink and glass slides.
58 International Journal of Bioprinting (2022)–Volume 8, Issue 1