
Page 186 - IJB-8-2
P. 186
Error Correction for Bioprinting
of the binarized helix are identified and extracted by the printed helix trajectory (solid flesh-colored line), the
Sobel operator, as shown in Figure 3C, to convert the estimated value of the printing helix centerline (red
abstract image data into specific point cloud data. Object dotted line), and the designed ideal reference trajectory
contour recognition is an emerging field of computer (black dotted line).
vision to visualize algorithms to recognize the contours
of objects to quickly determine the type of objects. The 3.2. Correct printing
convolution kernel is used to process the image matrix. The coordinate data of the ideal helix reference
Which is the most popular object contour recognition trajectory and printing helix trajectory could be
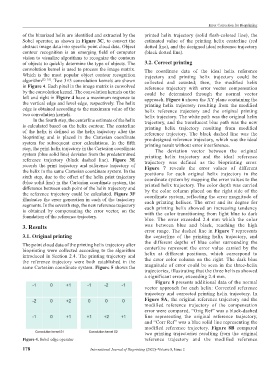
algorithm [32–35] . Two 3×3 convolution kernels are shown collected and counted; then, the modified helix
in Figure 4. Each pixel in the image matrix is convolved reference trajectory with error vector compensation
by the convolution kernel. The convolution kernels on the could be determined through the normal vector
left and right in Figure 4 have a maximum response to approach. Figure 6 shows the XY plane containing the
the vertical edge and level edge, respectively. The helix printing helix trajectory resulting from the modified
edge is obtained according to the maximum value of the helix reference trajectory and the original printing
two convolution kernels. helix trajectory. The white path was the original helix
In the fourth step, the centerline estimate of the helix trajectory, and the translucent blue path was the new
is calculated based on the helix contour. The centerline printing helix trajectory resulting from modified
of the helix is defined as the helix trajectory after the reference trajectory. The black dashed line was the
bioprinting and is placed in the Cartesian coordinate pre-designed reference trajectory, which was the ideal
system for subsequent error calculations. In the fifth printing result without error interference.
step, the print helix trajectory in the Cartesian coordinate The deviation vector between the original
system (blue solid line) deviates from the predetermined printing helix trajectory and the ideal reference
reference trajectory (black dashed line). Figure 3E trajectory was defined as the bioprinting error.
records the print trajectory and reference trajectory of Figure 7 reveals the error values of different
the helix in the same Cartesian coordinate system. In the positions for each original helix trajectory in the
sixth step, due to the offset of the helix print trajectory coordinate system by mapping the error values to the
(blue solid line) in the Cartesian coordinate system, the printed helix trajectory. The color depth was carried
difference between each point of the helix trajectory and by the color column placed on the right side of the
the reference trajectory could be calculated. Figure 3F coordinate system, reflecting the error magnitude of
illustrates the error generation in each of the trajectory each printing helixes. The error and its degree for
segments. In the seventh step, the new reference trajectory each printing helix showed an increasing tendency
is obtained by compensating the error vector, on the with the color transitioning from light blue to dark
foundation of the reference trajectory.
blue. The error exceeded 2.4 mm which the color
3. Results was between blue and black, reaching the high
error range. The dashed line in Figure 7 represents
3.1. Original printing the centerline of the printing helix trajectory, and
the different depths of blue color surrounding the
The point cloud data of the printing helix trajectory after centerline represent the error value carried by the
bioprinting were collected according to the algorithm
introduced in Section 2.4. The printing trajectory and helix at different positions, which correspond to
the reference trajectory were both established in the the error color column on the right. The dark blue
same Cartesian coordinate system. Figure 5 shows the magnitude of error could be seen in the three-helix
trajectories, illustrating that the three helixes showed
a significant error, exceeding 2.4 mm.
Figure 8 presents additional data of the normal
vector approach for each helix: Corrected reference
trajectory and corrected printing helix trajectory. In
Figure 8A, the original reference trajectory and the
modified reference trajectory of the compensation
error were compared. “Orig Ref” was a black-dashed
line representing the original reference trajectory,
and “Corr Ref” was a blue solid line representing the
modified reference trajectory. Figure 8B compared
two printing trajectories resulting from the original
Figure 4. Sobel edge operator reference trajectory and the modified reference
178 International Journal of Bioprinting (2022)–Volume 8, Issue 2