
Page 188 - IJB-8-2
P. 188
Error Correction for Bioprinting
A B C
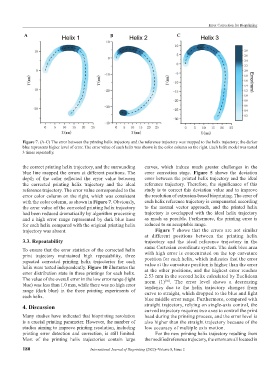
Figure 7. (A-C) The error between the printing helix trajectory and the reference trajectory was mapped to the helix trajectory; the darker
blue represents higher level of error. The error value of each helix was shown in the color column on the right. Each helix model was tested
3 times repeatedly.
the correct printing helix trajectory, and the surrounding curves, which induce much greater challenges in the
blue line mapped the errors at different positions. The error correction stage. Figure 5 shows the deviation
depth of the color reflected the error value between error between the printed helix trajectory and the ideal
the corrected printing helix trajectory and the ideal reference trajectory. Therefore, the significance of this
reference trajectory. The error value corresponded to the study is to correct this deviation value and to improve
error color column on the right, which was consistent the resolution of extrusion-based bioprinting. The error of
with the color column, as shown in Figure 7. Obviously, each helix reference trajectory is compensated according
the error value of the corrected printing helix trajectory to the normal vector approach, and the printed helix
had been reduced dramatically by algorithm processing trajectory is overlapped with the ideal helix trajectory
and a high error range represented by dark blue hues as much as possible. Furthermore, the printing error is
for each helix compared with the original printing helix reduced to an acceptable range.
trajectory was absent. Figure 7 shows that the errors are not similar
at different positions between the printing helix
3.3. Repeatability trajectory and the ideal reference trajectory in the
same Cartesian coordinate system. The dark blue area
To ensure that the error statistics of the corrected helix with high error is concentrated on the top curvature
print trajectory maintained high repeatability, three
repeated corrected printing helix trajectories for each position for each helix, which indicates that the error
helix were tested independently. Figure 10 illustrates the value at the curvature position is higher than the error
at the other positions, and the highest error reaches
error distribution state in three printings for each helix. 2.53 mm in the second helix calculated by Euclidean
The value of the overall error in the low error range (light norm (1) [36] . The error level shows a decreasing
blue) was less than 1.0 mm, while there was no high error tendency due to the helix trajectory changes from
range (dark blue) in the three printing experiments of curve to straight, which dropped to the blue and light
each helix. blue middle error range. Furthermore, compared with
4. Discussion straight trajectory, relying on single-axis control, the
curved trajectory requires two axes to control the print
Many studies have indicated that bioprinting resolution head during the printing process, and the error level is
is a crucial printing parameter. However, the number of also higher than the straight trajectory because of the
studies aiming to improve printing resolution, including low accuracy of multiple axis motion.
printing error detection and correction, is still limited. For the new printing helix trajectory resulting from
Most of the printing helix trajectories contain large the modified reference trajectory, the errors are all located in
180 International Journal of Bioprinting (2022)–Volume 8, Issue 2