
Page 189 - IJB-8-2
P. 189
Liu, et al.
A
B
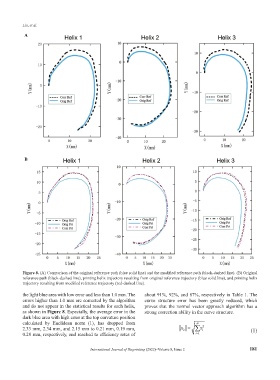
Figure 8. (A) Comparison of the original reference path (blue solid line) and the modified reference path (black-dashed line). (B) Original
reference path (black-dashed line), printing helix trajectory resulting from original reference trajectory (blue solid line), and printing helix
trajectory resulting from modified reference trajectory (red-dashed line).
the light blue area with low error and less than 1.0 mm. The about 91%, 92%, and 87%, respectively in Table 1. The
errors higher than 1.0 mm are corrected by the algorithm curve structure error has been greatly reduced, which
and do not appear in the statistical results for each helix, proves that the normal vector approach algorithm has a
as shown in Figure 8. Especially, the average error in the strong correction ability in the curve structure.
dark blue area with high error at the top curvature position
calculated by Euclidean norm (1), has dropped from N
x
2.33 mm, 2.34 mm, and 2.15 mm to 0.21 mm, 0.19 mm, x 2 = ∑ i 2 (1)
0.28 mm, respectively, and reached to efficiency rates of = i 1
International Journal of Bioprinting (2022)–Volume 8, Issue 2 181