
Page 81 - IJB-8-2
P. 81
Mieloch, et al.
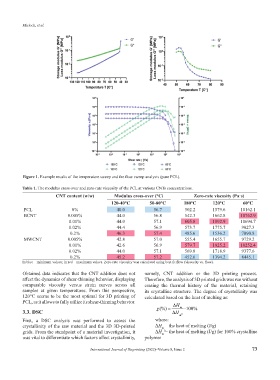
Figure 1. Example results of the temperature sweep and the flow sweep analysis (pure PCL).
Table 1. The modulus cross-over and zero-rate viscosity of the PCL at various CNTs concentrations.
CNT content (w/w) Modulus cross‑over (°C) Zero‑rate viscosity (Pa·s)
120‑40°C 50‑80°C 180°C 120°C 60°C
PCL 0% 40.0 56.7 502.2 1579.6 10162.1
BCNT 0.005% 44.0 56.8 542.3 1662.8 10762.9
0.01% 44.0 57.1 605.8 1892.9 10694.7
0.02% 44.4 56.9 573.7 1775.7 9027.3
0.2% 46.3 57.4 485.6 1536.2 7090.8
MWCNT 0.005% 42.8 57.0 555.4 1655.7 9729.2
0.01% 42.6 56.9 579.7 1825.2 10252.4
0.02% 44.0 57.1 569.8 1718.9 9377.6
0.2% 45.2 57.2 452.6 1394.2 8445.1
In blue – minimum values; in red – maximum values. Zero-rate viscosity was calculated using best fit flow (viscosity vs. flow).
Obtained data indicates that the CNT addition does not namely, CNT addition or the 3D printing process.
affect the dynamics of shear-thinning behavior, displaying Therefore, the analysis of 3D printed grids was run without
comparable viscosity versus strain curves across all erasing the thermal history of the material, retaining
samples at given temperatures. From this perspective, its crystalline structure. The degree of crystallinity was
120°C seems to be the most optimal for 3D printing of calculated based on the heat of melting as:
PCL, as it allows to fully utilize its shear-thinning behavior. ∆H
χ (%) = m ⋅ 100%
3.3. DSC ∆H
m 0
First, a DSC analysis was performed to assess the where:
crystallinity of the raw material and the 3D 3D-printed ΔH – the heat of melting (J/g)
m
0
grids. From the standpoint of a material investigation, it ΔH – the heat of melting (J/g) for 100% crystalline
m
was vital to differentiate which factors affect crystallinity, polymer
International Journal of Bioprinting (2022)–Volume 8, Issue 2 73