
Page 82 - IJB-8-2
P. 82
CNT/PCL Nanocomposite for Tissue Engineering
The melting heat for 100% crystalline PCL is 3.4. Nanoindentation
139.5 J/g, which was adopted from the literature . The
[25]
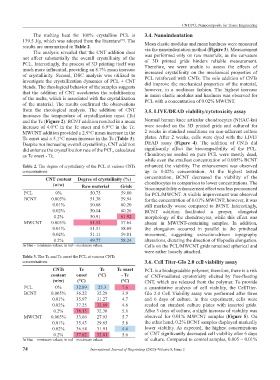
results are summarized in Table 2. Mean elastic modulus and mean hardness were measured
via the nanoindentation method (Figure 3). Measurement
The analysis revealed that the CNT addition does
not affect substantially the overall crystallinity of the was performed only on raw materials, as the curvature
of 3D printed grids hinders reliable measurement.
PCL. Interestingly, the process of 3D printing itself was Therefore, we were unable to assess the effects of
much more influential, providing an 8.7% mean increase increased crystallinity on the mechanical properties of
of crystallinity. Second, DSC analysis was utilized to PCL reinforced with CNTs. The sole addition of CNTs
investigate the crystallization dynamics of PCL + CNT did improve the mechanical properties of the material,
blends. The rheological behavior of the samples suggests however, in a nonlinear fashion. The highest increase
that the addition of CNT accelerates the solidification in mean elastic modulus and hardness was observed for
of the melts, which is associated with the crystallization PCL with a concentration of 0.02% MWCNT.
of the material. The results confirmed the observations
from the rheological analysis. The addition of CNT 3.5. LIVE/DEAD viability/cytotoxicity assay
increases the temperature of crystallization onset (Tc)
and the Tc (Figure 2). BCNT addition resulted in a mean Normal human knee articular chondrocytes (NHAC-kn)
increase of 4.0°C in the Tc onset and 6.9°C in the Tc. were seeded on the 3D printed grids and cultured for
MWCNT addition provided a 2.9°C mean increase in the 2 weeks in standard conditions on non-adherent culture
Tc onset and a 5.1°C mean increase in the Tc (Table 3). plates. After 2 weeks, cells were dyed with the LIVE/
Despite not increasing overall crystallinity, CNT addition DEAD assay (Figure 4). The addition of CNTs did
did enhance the crystallization rate of the PCL, calculated significantly affect the biocompatibility of the PCL.
as Tc onset - Tc. Chondrocytes seeded on pure PCL were mostly dead,
while even the smallest concentration of 0.005% BCNT
Table 2. The degree of crystallinity of the PCL at various CNTs enhanced the viability. The enhancement was observed
concentrations. up to 0.02% concentration. At the highest tested
CNT content Degree of crystallinity (%) concentration, BCNT decreased the viability of the
(w/w) Raw material Grids chondrocytes in comparison to lower concentrations. The
biocompatibility enhancement effect was less pronounced
PCL 0% 50.75 59.00 for PCL/MWCNT. A visible improvement was observed
BCNT 0.005% 51.38 59.94 for the concentration of 0.01% MWCNT; however, it was
0.01% 50.68 60.20 still markedly worse compared to BCNT. Interestingly,
0.02% 50.14 60.26 BCNT addition facilitated a proper, elongated
0.2% 50.91 61.92 morphology of the chondrocytes, while this effect was
MWCNT 0.005% 51.52 57.64 absent in MWCNT-containing samples. In addition,
0.01% 51.31 58.89 the elongation occurred in parallel to the printhead
0.02% 51.11 59.81 movement, suggesting extrusion-driven topography
0.2% 49.77 58.24 alterations, dictating the direction of filopodia elongation.
In blue – minimum values; in red – maximum values. Cells on the PCL/MWCNT grids remained spherical and
were rather loosely attached.
Table 3. The Tc and Tc onset the PCL at various CNTs
concentrations. 3.6. Cell Titer-Glo 2.0 cell viability assay
CNTs Tc Tc Tc onset PCL is a biodegradable polymer; therefore, there is a risk
content onset (°C) - Tc of CNT-mediated cytotoxicity elicited by free-floating
(w/w) (°C) (°C) CNT, which are released from the polymer. To provide
PCL 0% 32.89 25.3 7.6 a quantitative analysis of cell viability, the CellTiter-
BCNT 0.005% 36.22 32.29 3.9 Glo 2.0 Cell Viability assay was performed after three
0.01% 35.97 31.27 4.7 and 6 days of culture. In this experiment, cells were
0.02% 37.25 32.69 4.6 seeded on standard culture plates with inserted grids.
0.2% 38.13 32.38 5.8 After 3 days of culture, a slight increase of viability was
MWCNT 0.005% 33.66 27.93 5.7 observed for 0.01% MWCNT samples (Figure 5). On
0.01% 35.43 29.65 5.8 the other hand, 0.2% BCNT samples displayed markedly
0.02% 36.54 31.91 4.6 lower viability. As expected, the highest concentrations
0.2% 37.62 32.01 5.6 of CNT significantly decreased cell viability after 6 days
In blue – minimum values; in red – maximum values. of culture. Compared to control samples, 0.005 – 0.01%
74 International Journal of Bioprinting (2022)–Volume 8, Issue 2