
Page 189 - IJB-8-3
P. 189
He, et al.
A
B C
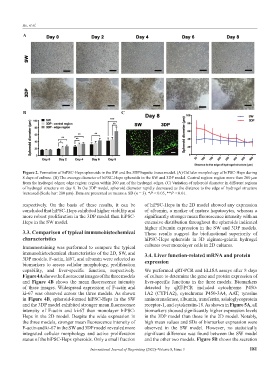
Figure 2. Formation of hiPSC-Heps spheroids in the SW and the 3DP hepatic tissue model. (A) Cellular morphology of hiPSC-Heps during
8 days of culture. (B) The average diameter of hiPSC-Heps spheroids in the SW and 3DP model. Central region: region more than 200 μm
from the hydrogel edges; edge region: region within 200 μm of the hydrogel edges. (C) Variation of spheroid diameter in different regions
of hydrogel structure on day 8. In the 3DP model, spheroid diameter rapidly decreased as the distance to the edge of hydrogel structure
increased (Scale bar: 200 μm). Data are presented as means ± SD (n = 3). *P < 0.05, **P < 0.01.
respectively. On the basis of these results, it can be of hiPSC-Heps in the 2D model showed any expression
concluded that hiPSC-Heps exhibited higher viability and of albumin, a marker of mature hepatocytes, whereas a
more robust proliferation in the 3DP model than hiPSC- significantly stronger mean fluorescence intensity with an
Heps in the SW model. extensive distribution throughout the spheroids indicated
higher albumin expression in the SW and 3DP models.
3.3. Comparison of typical immunohistochemical These results suggest the biofunctional superiority of
characteristics hiPSC-Heps spheroids in 3D alginate-gelatin hydrogel
Immunostaining was performed to compare the typical cultures over monolayer cells in 2D cultures.
immunohistochemical characteristics of the 2D, SW, and 3.4. Liver function-related mRNA and protein
3DP models. F-actin, ki67, and albumin were selected as expression
biomarkers to assess cellular morphology, proliferation
capability, and liver-specific function, respectively. We performed qRT-PCR and ELISA assays after 8 days
Figure 4A shows the fluorescent images of the three models of culture to determine the gene and protein expression of
and Figure 4B shows the mean fluorescence intensity liver-specific functions in the three models. Biomarkers
of these images. Widespread expression of F-actin and detected by qRT-PCR included cytochrome P450-
ki-67 was observed across the three models. As shown 1A2 (CYP1A2), cytochrome P450-3A4, AAT, tyrosine
in Figure 4B, spheroid-formed hiPSC-Heps in the SW aminotransferase, albumin, transferrin, asialoglycoprotein
and the 3DP model exhibited stronger mean fluorescence receptor-1, and cytokeratin-18. As shown in Figure 5A, all
intensity of F-actin and ki-67 than monolayer hiPSC- biomarkers showed significantly higher expression levels
Heps in the 2D model. Despite the wide expression in in the 3DP model than those in the 2D model. Notably,
the three models, stronger mean fluorescence intensity of high mean values and SDs of biomarker expression were
F-actin and ki-67 in the SW and 3DP model revealed more observed in the SW model. However, no statistically
integrated cellular morphology and active proliferation significant difference was found between the SW model
status of the hiPSC-Heps spheroids. Only a small fraction and the other two models. Figure 5B shows the secretion
International Journal of Bioprinting (2022)–Volume 8, Issue 3 181