
Page 190 - IJB-8-3
P. 190
Bioprinting of a Hepatic Tissue Model
A
B C
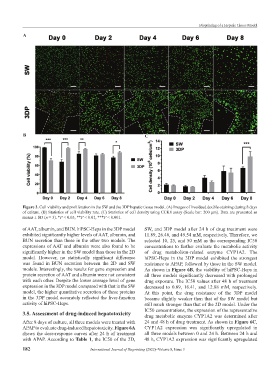
Figure 3. Cell viability and proliferation in the SW and the 3DP hepatic tissue model. (A) Images of live/dead double-staining during 8 days
of culture. (B) Statistics of cell viability rate. (C) Statistics of cell density using CCK8 assay (Scale bar: 200 μm). Data are presented as
means ± SD (n = 3). *P < 0.05, **P < 0.01, ***P < 0.001.
of AAT, albumin, and BUN. hiPSC-Heps in the 3DP model SW, and 3DP model after 24 h of drug treatment were
exhibited significantly higher levels of AAT, albumin, and 11.89, 26.48, and 49.54 mM, respectively. Therefore, we
BUN secretion than those in the other two models. The selected 10, 25, and 50 mM as the corresponding IC50
expressions of AAT and albumin were also found to be concentrations to further evaluate the metabolic activity
significantly higher in the SW model than those in the 2D of drug metabolism-related enzyme CYP1A2. The
model. However, no statistically significant difference hiPSC-Heps in the 3DP model exhibited the strongest
was found in BUN secretion between the 2D and SW resistance to APAP, followed by those in the SW model.
models. Interestingly, the results for gene expression and As shown in Figure 6B, the viability of hiPSC-Heps in
protein secretion of AAT and albumin were not consistent all three models significantly decreased with prolonged
with each other. Despite the lower average level of gene drug exposure. The IC50 values after 48 h of treatment
expression in the 3DP model compared with that in the SW decreased to 0.89, 16.41, and 12.88 mM, respectively.
model, the higher quantitative secretion of these proteins At this point, the drug resistance of the 3DP model
in the 3DP model accurately reflected the liver-function became slightly weaker than that of the SW model but
activity of hiPSC-Heps. still much stronger than that of the 2D model. Under the
IC50 concentrations, the expression of the representative
3.5. Assessment of drug-induced hepatotoxicity drug metabolic enzyme CYP1A2 was determined after
After 8 days of culture, all three models were treated with 24 and 48 h of drug treatment. As shown in Figure 6C,
APAP to evaluate drug-induced hepatotoxicity. Figure 6A CYP1A2 expression was significantly upregulated in
shows the dose-response curves after 24 h of treatment all three models between 0 and 24 h. Between 24 h and
with APAP. According to Table 1, the IC50 of the 2D, 48 h, CYP1A2 expression was significantly upregulated
182 International Journal of Bioprinting (2022)–Volume 8, Issue 3