
Page 283 - IJB-8-3
P. 283
Zheng, et al.
junction of the skin and the bioink. During the 2 week, than in the other groups (0.0016±0.0009 in the hydrogel
nd
inflammatory cells increased in the bioink. However, encapsulating POCs group and 0.0032 ± 0.0008 in the
from the 2 to 9 week, the total amount of inflammatory 3D scaffold group (P = 0.000 and 0.001). The expression
th
nd
cells decreased, and the volume of bioink injected in of CD31 in the hydrogel encapsulating POCs group was
the 9 week was significantly lower than that in the lower than the 3D scaffold group (P = 0.042) (Figure 6G).
th
1 week. Furthermore, the expression of CD45 (identify POCs were immune stained with Ki67 to evaluate
st
the inflammatory cells) was similar to the H&E staining the cell proliferation (Figure 6D-F). More positive Ki67
results (Figure 3E). signals (cells in brown) were detected in the 3D scaffold
encapsulating POCs group (0.0074 ± 0.0017) than in the
3.3. Viability of POCs in the 3D scaffold in vitro hydrogel encapsulating POCs group (0.0036 ± 0.0010
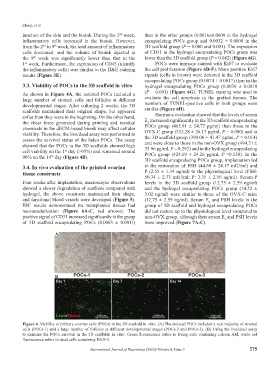
As shown in Figure 4A, the isolated POCs included a (P = 0.001) (Figure 6G). TUNEL staining was used to
large number of stromal cells and follicles at different evaluate the cell apoptosis in the grafted tissues. The
developmental stages. After culturing 2 weeks, the 3D numbers of TUNEL-positive cells in both groups were
scaffolds maintained their original shape, but appeared similar (Figure 6H).
softer than they were in the beginning. On the other hand, Hormone evaluation showed that the levels of serum
the shear force generated during printing and residual E increased significantly in the 3D scaffold encapsulating
2
chemicals in the dECM-based bioink may affect cellular POCs group (465.91 ± 24.77 pg/ml) than those in the
viability. Therefore, the live/dead assay was performed to OVX-C group (332.28 ± 26.17 pg/ml, P = 0.000) and in
the 3D scaffold group (390.06 ± 41.47 pg/ml, P = 0.014)
assess the survival status of the laden POCs. The assay and were close to those in the non-OVX group (494.31 ±
showed that the POCs in the 3D scaffolds showed high 35.96 pg/ml, P = 0.292) and in the hydrogel encapsulating
cell viability on the 1 day (>95%) and remained around POCs group (424.69 ± 24.26 pg/ml, P =0.138). In the
st
90% on the 14 day (Figure 4B).
th
3D scaffold encapsulating POCs group, implantation led
3.4. In vivo evaluation of the printed ovarian to the restoration of FSH (44.69 ± 24.17 mIU/ml) and
tissue constructs P (2.55 ± 1.34 ng/ml) to the physiological level (FSH:
50.34 ± 2.73 mIU/ml; P: 3.35 ± 2.56 ng/ml). Serum P
Four weeks after implantation, macroscopic observations levels in the 3D scaffold group (12.75 ± 2.59 ng/ml)
showed a slower degradation of scaffolds compared with and the hydrogel encapsulating POCs group (14.52 ±
hydrogel, the above constructs maintained their shape, 3.02 ng/ml) were similar to those of the OVX-C mice
and functional blood vessels were developed (Figure 5). (12.75 ± 2.59 ng/ml). Serum E and FSH levels in the
2
IHC results demonstrated the transplanted tissues had group of 3D scaffold and hydrogel encapsulating POCs
neovascularization (Figure 6A-C, red arrows). The did not restore up to the physiological level compared to
positive signal of CD31 increased significantly in the group non-OVX group, although their serum E and FSH levels
2
of 3D scaffold encapsulating POCs (0.0063 ± 0.0011) were improved (Figure 7A-C).
A
B
Figure 4. Viability of primary ovarian cells (POCs) in the 3D scaffold in vitro. (A) The isolated POCs included a vast majority of stromal
cells (POCs-1) and a large number of follicles at different developmental stages (POCs-2 and POCs-3). (B) Using the live/dead assay
to examine the POCs survival in the 3D scaffolds in vitro. Green fluorescence refers to living cells containing calcein AM, while red
fluorescence refers to dead cells containing EthD-1.
International Journal of Bioprinting (2022)–Volume 8, Issue 3 275