
Page 285 - IJB-8-3
P. 285
Zheng, et al.
A B C
D E
F G
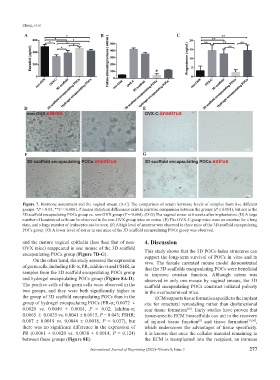
Figure 7. Hormone assessment and the vaginal smear. (A-C) The comparison of serum hormone levels of samples from five different
groups. *P < 0.05, **P < 0.0001. # means statistical differences exist in pairwise comparison between the groups (P ≤ 0.001), but not in the
3D scaffold encapsulating POCs group vs. non-OVX group (P = 0.684). (D-G) The vaginal smear at 4 weeks after implantation. (D) A large
number of keratinized cells can be observed in the non-OVX group mice on estrus. (E) The OVX-C group mice were on anestrus for a long
time, and a large number of leukocytes can be seen. (F) A high level of anestrus was observed in three mice of the 3D scaffold encapsulating
POCs group. (G) A lower level of estrus in one mice of the 3D scaffold encapsulating POCs group was observed.
and the mature vaginal epithelia (less than that of non- 4. Discussion
OVX mice) reappeared in one mouse of the 3D scaffold This study shows that the 3D POCs-laden structures can
encapsulating POCs group (Figure 7D-G). support the long-term survival of POCs in vitro and in
On the other hand, the study assessed the expression vivo. The female castrated mouse model demonstrated
of germ cells, including ER-α, PR, inhibin-α and FSHR, in that the 3D scaffolds encapsulating POCs were beneficial
samples from the 3D scaffold encapsulating POCs group to improve ovarian function. Although estrus was
and hydrogel encapsulating POCs group (Figure 8A-D). observed in only one mouse by vaginal smears, the 3D
The positive cells of the germ cells were observed in the scaffold encapsulating POCs construct initiated puberty
two groups, and they were both significantly higher in in the ovariectomized mice.
the group of 3D scaffold encapsulating POCs than in the ECM supports tissue formation specific to the implant
group of hydrogel encapsulating POCs (ER-α; 0.0072 ± site for structural remodeling rather than dysfunctional
0.0020 vs. 0.0049 ± 0.0014, P = 0.02; Inhibin-α; scar tissue formation . Early studies have proven that
[18]
0.0065 ± 0.0025 vs. 0.0041 ± 0.0015, P = 0.043; FSHR; tissue-specific ECM bioscaffolds can aid in the recovery
0.007 ± 0.0019 vs. 0.0046 ± 0.0018, P = 0.037), but of injured tissue function and tissue formation [19,20] ,
[8]
there was no significant difference in the expression of which underscores the advantages of tissue specificity.
PR (0.0061 ± 0.0020 vs. 0.0038 ± 0.0014, P = 0.124) It is known that once the cellular material remaining in
between these groups (Figure 8E). the ECM is transplanted into the recipient, an immune
International Journal of Bioprinting (2022)–Volume 8, Issue 3 277