
Page 119 - IJB-8-4
P. 119
Wang, et al.
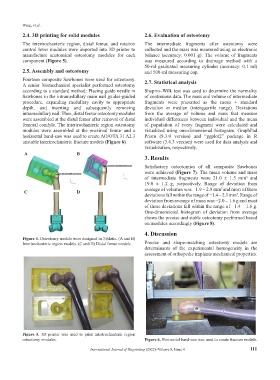
2.4. 3D printing for solid modules 2.6. Evaluation of osteotomy
The intertrochanteric region, distal femur, and rotation The intermediate fragments after osteotomy were
control lever modules were imported into 3D printer to collected and the mass was measured using an electronic
manufacture anatomical osteotomy modules for each balance (accuracy: 0.001 g). The volume of fragments
component (Figure 5). was measured according to drainage method with a
50-ml graduated measuring cylinder (accuracy: 0.1 ml)
2.5. Assembly and osteotomy and 500-ml measuring cup.
Fourteen composite Sawbones were used for osteotomy. 2.7. Statistical analysis
A senior biomechanical specialist performed osteotomy
according to a standard method: Placing guide needle in Shapiro–Wilk test was used to determine the normality
Sawbones in the intramedullary main nail guides-guided of continuous data. The mass and volume of intermediate
procedure, expanding medullary cavity to appropriate fragments were presented as the mean ± standard
depth, and inserting and subsequently removing deviation or median (interquartile range). Deviations
intramedullary nail. Then, distal femur osteotomy modules from the average of volume and mass that measure
were assembled at the distal femur after removal of distal individual differences between individual and the mean
femoral condyle. The intertrochanteric region osteotomy of population of every fragment were calculated and
modules were assembled at the proximal femur and a visualized using one-dimensional histogram. GraphPad
horizontal band-saw was used to create AO/OTA 31 A2.3 Prism (8.3.0 version) and “ggplot2” package in R
unstable intertrochanteric fracture models (Figure 6). software (3.6.3 version) were used for data analysis and
visualization, respectively.
A B
3. Results
Satisfactory osteotomies of all composite Sawbones
were achieved (Figure 7). The mean volume and mass
of intermediate fragments were 21.0 ± 1.5 mm and
3
19.0 ± 1.2 g, respectively. Range of deviation from
average of volumes was −1.9 – 2.8 mm and most of these
3
C D
deviations fall within the range of −1.4 – 2.1 mm . Range of
3
deviation from average of mass was −2.0 – 1.6 g and most
of these deviations fall within the range of −1.4 – 1.6 g.
One-dimensional histogram of deviation from average
shows the precise and stable osteotomy performed based
on modules accordingly (Figure 8).
4. Discussion
Figure 4. Osteotomy models were designed in 3-Matic. (A and B)
Intertrochanteric region models. (C and D) Distal femur models. Precise and shape-matching osteotomy models are
determinants of the experimental homogeneity in the
assessment of orthopedic implants mechanical properties.
Figure 5. 3D printer was used to print intertrochanteric region
osteotomy modules. Figure 6. Horizontal band-saw was used to create fracture models.
International Journal of Bioprinting (2022)–Volume 8, Issue 4 111