
Page 324 - IJB-8-4
P. 324
Deep learning for EBB control
misunderstand some prints as “ok” when their true class optimization procedure by introducing the “small
is different. This behavior was observed especially for perturbations” step, as previously described.
those printing parameters that are close to the optimal Figure 4D and E shows the results related to the
and in which the resulting shape is difficult to classify robustness evaluation of the DL model. As shown in
from the front view videos even by the experimenter. This Figure 4D, the model correctly predicts the class even if
uncertainty was accounted for in the automatic parameter there are changes in zoom and focus levels. Furthermore,
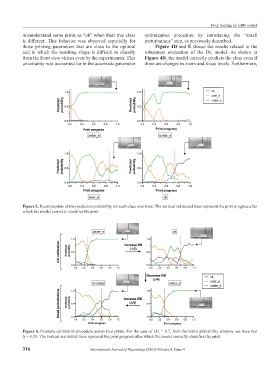
Figure 5. Example plots of the prediction probability for each class over time. The vertical red dotted lines represent the print progress after
which the model correctly classifies the print.
Figure 6. Example calibration procedure across four prints. For the case of LH = 0.7, from the initial printability window, we have that
i
Δ = 0.31. The vertical red dotted lines represent the print progress after which the model correctly classifies the print.
316 International Journal of Bioprinting (2022)–Volume 8, Issue 4