
Page 325 - IJB-8-4
P. 325
Bonatti, et al.
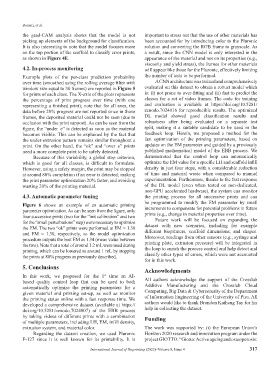
the grad-CAM analysis shows that the model is not important to stress out that the use of other materials has
picking up elements of the background for classification. been accounted for by introducing color to the Pluronic
It is also interesting to note that the model focuses more solution and converting the RGB frame to grayscale. As
on the top portion of the scaffold to classify error prints, a result, since the CNN model is only interested in the
as shown in Figure 4E. appearance of the material and not on its properties (e.g.,
viscosity and yield stress), the frames for other materials
4.2. In-process monitoring will appear like those for the Pluronic, effectively limiting
Example plots of the per-class prediction probability the number of tests to be performed.
over time (smoothed using the rolling average filter with A CNN architecture was trained and comprehensively
window size equal to 30 frames) are reported in Figure 5 evaluated on this dataset to obtain a robust model which
for prints of each class. The X-axis of the plots represents is: (i) not prone to over-fitting and (ii) fast to predict the
the percentage of print progress over time (with one classes for a set of video frames. The code for training
representing a finished print); note that for all axes, the and evaluation is available at https://doi.org/10.5281/
data before 20% progress are not reported since in those zenodo.7024016 for reproducible results. The optimized
frames, the deposited material could not be seen (due to DL model showed good classification results and
occlusion with the print support). As can be seen from the robustness after being evaluated on a separate test
figure, the “under_e” is detected as soon as the material split, making it a suitable candidate to be used in the
becomes visible. This can be explained by the fact that feedback loop. Herein, we proposed a method for the
the under-extrusion pattern remains similar throughout a fast optimization of the printing parameters, based on
print. On the other hand, the “ok” and “over_e” prints updates on the EM parameter and guided by a previously
need a more complete print to be safely detected. published mathematical model of the EBB process. We
Because of this variability, a global stop criterion, demonstrated that the control loop can automatically
which is good for all classes, is difficult to formulate. optimize the EM value for a specific LH and scaffold infill
However, using a safety margin, the print may be stopped density in just four steps, with a considerable reduction
at around 80% completion if an error is detected, making of time and material waste when compared to manual
the print parameter optimization 20% faster, and avoiding experimentation. Furthermore, thanks to the fast response
wasting 20% of the printing material. of the DL model (even when tested on non-dedicated,
non-GPU accelerated hardware), the system can monitor
4.3. Automatic parameter tuning the printing process for all successive prints and can
Figure 6 shows an example of an automatic printing be programmed to modify the EM parameter by small
parameter optimization. As can be seen from the figure, only increments to compensate for potential problems in future
four successive prints (two for the “init calibration” and two prints (e.g., change in material properties over time).
for the “small perturbations” step) were necessary to optimize Future work will be focused on expanding the
the EM. The two “ok” prints were performed at EM = 1.38 dataset with new scenarios, including for example
and EM = 1.30, respectively, so the model optimization different bioprinters, scaffold dimensions, and shapes.
procedure outputs the best EM as 1.34 (mean value between Moreover, readings from other sensors (e.g., syringe and
the two). Note that a total of around 1.2 mL were used during printing plate, extrusion pressure) will be integrated in
printing, which can be lowered to around 1 mL by stopping the loop to enrich the process control and help detect and
the prints at 80% progress as previously described. classify other types of errors, which were not accounted
for in this work.
5. Conclusions Acknowledgments
In this work, we proposed for the 1 time an AI-
st
based quality control loop that can be used to both All authors acknowledge the support of the Crosslab
automatically optimize the printing parameters for a Additive Manufacturing and the Crosslab Cloud
given material and printing set-up, as well as monitor Computing, Big Data & Cybersecurity of the Department
the printing status online with a fast response time. We of Information Engineering of the University of Pisa. All
developed a comprehensive dataset (available at https:// authors would like to thank Brandon Kaiheng Tay for his
doi.org/10.5281/zenodo.7024007) of the EBB process help in collecting the dataset.
by taking videos of different prints with a combination Funding
of multiple parameters, including LH, EM, infill density,
extrusion system, and material color. The work was supported by: (i) the European Union’s
Regarding the dataset creation, we used Pluronic Horizon 2020 research and innovation program under the
F-127 since it is well known for its printability. It is project GIOTTO: “Giotto: Active ageing and osteoporosis:
International Journal of Bioprinting (2022)–Volume 8, Issue 4 317