
Page 146 - IJB-9-1
P. 146
International Journal of Bioprinting BNC-reinforced GelMa enhances property of bioprinted cartilage
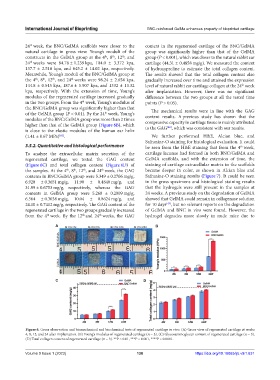
24 week, the BNC/GelMA scaffolds were closer to the content in the regenerated cartilage of the BNC/GelMA
th
natural cartilage in gross view. Young’s moduli of the group was significantly higher than that of the GelMA
constructs in the GelMA group at the 4 , 8 , 12 , and group (P < 0.001), which was closer to the natural rabbit ear
th
th
th
24 weeks were 84.78 ± 1.239 kpa, 104.0 ± 3.372 kpa, cartilage (44.31 ± 0.4858 mg/g). We measured the content
th
137.7 ± 2.510 kpa, and 645.2 ± 14.02 kpa, respectively. of hydroxyproline to estimate the total collagen content.
Meanwhile, Young’s moduli of the BNC/GelMA group at The results showed that the total collagen content also
the 4 , 8 , 12 , and 24 weeks were 98.24 ± 2.654 kpa, gradually increased over time and attained the expression
th
th
th
th
144.8 ± 0.545 kpa, 187.6 ± 5.907 kpa, and 1332 ± 13.32 level of natural rabbit ear cartilage collagen at the 24 week
th
kpa, respectively. With the extension of time, Young’s after implantation. However, there was no significant
modulus of the regenerated cartilage increased gradually difference between the two groups at all the tested time
in the two groups. From the 4 week, Young’s modulus of points (P > 0.05).
th
the BNC/GelMA group was significantly higher than that The mechanical results were in line with the GAG
of the GelMA group (P < 0.01). By the 24 week, Young’s content results. A previous study has shown that the
th
modulus of the BNC/GelMA group was more than 2 times compressive capacity in cartilage tissue is mainly attributed
higher than that of the GelMA group (Figure 6B), which to the GAG , which was consistent with our results.
[42]
is close to the elastic modulus of the human ear helix
(1.41 ± 0.67 MPa) . We further performed H&E, Alcian blue, and
[41]
Safranine-O staining for histological evaluation. It could
3.5.2. Quantitative and histological performance be seen from the H&E staining that from the 4 week,
th
To analyze the extracellular matrix secretion of the cartilage lacunae had formed in both BNC/GelMA and
regenerated cartilage, we tested the GAG content GelMA scaffolds, and with the extension of time, the
(Figure 6C) and total collagen content (Figure 6D) of staining of cartilage extracellular matrix in the scaffolds
the samples. At the 4 , 8 , 12 , and 24 week, the GAG became deeper in color, as shown in Alcian blue and
th
th
th
th
contents in BNC/GelMA group were 5.349 ± 0.2706 mg/g, Safranine-O staining results (Figure 7). It could be seen
6.928 ± 0.3651 mg/g, 11.90 ± 0.4840 mg/g, and in the gross specimens and histological staining results
31.99 ± 0.6753 mg/g, respectively, whereas the GAG that the hydrogels were still present in the samples at
contents in GelMA group were 5.268 ± 0.2009 mg/g, 24 weeks. A previous study on the degradation of GelMA
6.564 ± 0.3038 mg/g, 10.04 ± 0.8624 mg/g, and showed that GelMA could remain in collagenase solution
24.10 ± 0.7412 mg/g, respectively. The GAG content of the for 10 days , but no relevant reports on the degradation
[43]
regenerated cartilage in the two groups gradually increased of GelMA and BNC in vivo were found. However, the
from the 4 week. By the 12 and 24 weeks, the GAG hydrogel degrades more slowly in nude mice due to
th
th
th
A B
C D
Figure 6. Gross observation and biomechanical and biochemical tests of regenerated cartilage in vivo. (A) Gross view of regenerated cartilage at weeks
4, 8, 12, and 24 after implantation. (B) Young’s modulus of regenerated cartilage (n = 3). (C) Glycosaminoglycan content of regenerated cartilage (n = 3).
(D) Total collagen content of regenerated cartilage (n = 3). **P < 0.01, ***P < 0.001, ****P < 0.0001.
Volume 9 Issue 1 (2023) 138 https://doi.org/10.18063/ijb.v9i1.631