
Page 330 - IJB-9-2
P. 330
International Journal of Bioprinting Engineered EVs increase viability of 3D printed cardiomyocytes
followed by a 2-h incubation with secondary antibodies, 3. Results and discussion
with 10-min PBS washing for three times in between the 3.1. Isolation and characterization of
incubation sessions.
macrophage-derived EVs
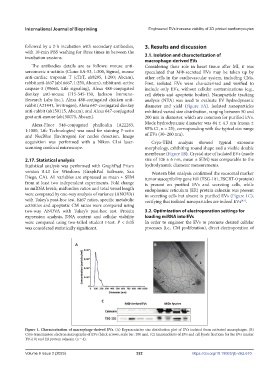
The antibodies details are as follows: mouse anti- Considering their role in heart tissue after MI, it was
sarcomeric α-actinin (Clone EA-53, 1:300, Sigma), mouse speculated that MΦ-secreted EVs may be taken up by
anti-cardiac troponin T (cTnT, ab8295, 1:200; Abcam), other cells in the cardiovascular system, including CMs.
rabbit anti-ki67 (ab16667, 1:250, Abcam), rabbit anti-active First, isolated EVs were characterized and verified to
caspase-3 (#9661, Life signaling), Alexa 488-conjugated include only EVs, without cellular contaminations (e.g.,
donkey anti-mouse (715-545-150, Jackson Immuno- cell debris and apoptotic bodies). Nanoparticle tracking
Research Labs Inc.), Alexa 488-conjugated chicken anti- analysis (NTA) was used to evaluate EV hydrodynamic
rabbit (A21441, Invitrogen), Alexa 647-conjugated donkey diameter and yield (Figure 1A). Isolated nanoparticles
anti-rabbit (ab150115, Abcam), and Alexa 647-conjugated exhibited varied size distribution, ranging between 50 and
goat anti-mouse (ab150075, Abcam). 200 nm in diameter, which are common for purified EVs.
Alexa-Fluor 546-conjugated phalloidin (A22283, Mode hydrodynamic diameter was 84 ± 4.3 nm (mean ±
1:1000, Life Technologies) was used for staining F-actin 95% CI, n = 25), corresponding with the typical size range
and NucBlue (Invitrogen) for nuclei detection. Image of EVs (30–200 nm).
acquisition was performed with a Nikon C1si laser- Cryo-TEM analysis showed typical exosome
scanning confocal microscope. morphology, exhibiting round shape and a visible double
membrane (Figure 1B). Crystal size of isolated EVs (mode
2.17. Statistical analysis size of 106 ± 6 nm, mean ± SEM) was comparable to the
Statistical analysis was performed with GraphPad Prism hydrodynamic diameter measurements.
version 8.43 for Windows (GraphPad Software, San Western blot analysis confirmed the exosomal marker
Diego, CA). All variables are expressed as mean ± SEM tumor susceptibility gene 101 (TSG-101, ESCRT-0 protein)
from at least two independent experiments. Fold change is present on purified EVs and secreting cells, while
in miRNA levels, midbodies ratios and total vessel length endoplasmic reticulum (ER) protein calnexin was present
were compared by one-way analysis of variance (ANOVA) in secreting cells but absent in purified EVs (Figure 1C),
with Tukey’s post-hoc test. Ki67 ratios, specific metabolic verifying that isolated nanoparticles are indeed EVs .
[43]
activities and apoptotic CM ratios were compared using
two-way ANOVA with Tukey’s post-hoc test. Protein 3.2. Optimization of electroporation settings for
expression analysis, DNA content and cellular viability loading miRNA into EVs
were compared using two-tailed student t-test. P < 0.05 In order to engineer the EVs to promote desired cellular
was considered statistically significant. processes (i.e., CM proliferation), direct electroporation of
Figure 1. Characterization of macrophage-derived EVs. (A) Representative size distribution plot of EVs isolated from activated macrophages. (B)
Cryo-transmission electron micrographs of EVs (black arrows; scale bar: 200 nm). (C) Immunoblots of EVs and cell lysate fractions for the EVs marker
TSG101 and ER protein calnexin (n = 4).
Volume 9 Issue 2 (2023) 322 https://doi.org/10.18063/ijb.v9i2.670