
Page 118 - IJB-9-3
P. 118
International Journal of Bioprinting OMT-loaded spinal cord scaffold
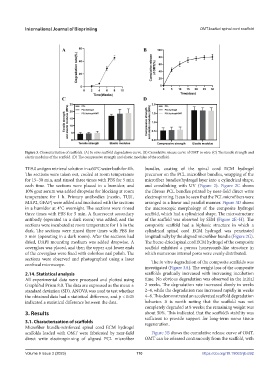
Figure 3. Characterization of scaffolds. (A) In vitro scaffold degradation curve. (B) Cumulative release curve of OMT in vitro. (C) The tensile strength and
elastic modulus of the scaffold. (D) The compressive strength and elastic modulus of the scaffold.
TE9.0 antigen retrieval solution in a 60°C water bath for 4 h. bundles, coating of the spinal cord ECM hydrogel
The sections were taken out, cooled at room temperature precursor on the PCL microfiber bundles, wrapping of the
for 15–30 min, and rinsed three times with PBS for 5 min microfiber bundles/hydrogel layer into a cylindrical shape,
each time. The sections were placed in a humidor, and and crosslinking with UV (Figure 2). Figure 2C shows
10% goat serum was added dropwise for blocking at room the fibrous PCL bundles printed by near-field direct write
temperature for 1 h. Primary antibodies (nestin, TUJ1, electrospinning. It can be seen that the PCL microfibers were
MAP2, GFAP) were added and incubated with the sections arranged in a linear and parallel manner. Figure 3D shows
in a humidor at 4°C overnight. The sections were rinsed the macroscopic morphology of the composite hydrogel
three times with PBS for 5 min. A fluorescent secondary scaffold, which had a cylindrical shape. The microstructure
antibody (operated in a dark room) was added, and the of the scaffold was observed by SEM (Figure 2E–H). The
sections were incubated at room temperature for 1 h in the composite scaffold had a biphasic structure in which a
dark. The sections were rinsed three times with PBS for cylindrical spinal cord ECM hydrogel was penetrated
5 min (operating in a dark room). After the sections had longitudinally by the aligned microfiber bundle (Figure 2G).
dried, DAPI mounting medium was added dropwise. A The freeze-dried spinal cord ECM hydrogel of the composite
coverglass was placed, and then the upper and lower ends scaffold exhibited a porous honeycomb-like structure in
of the coverglass were fixed with colorless nail polish. The which numerous internal pores were evenly distributed.
sections were observed and photographed using a laser The in vitro degradation of the composite scaffolds was
confocal microscope.
investigated (Figure 3A). The weight loss of the composite
2.14. Statistical analysis scaffolds gradually increased with increasing incubation
All experimental data were processed and plotted using time. No obvious degradation was observed in the initial
GraphPad Prism 8.0. The data are expressed as the mean ± 2 weeks. The degradation rate increased slowly in weeks
standard deviation (SD). ANOVA was used to test whether 2–4, while the degradation rate increased rapidly in weeks
the obtained data had a statistical difference, and p < 0.05 4–8. This demonstrated an accelerated scaffold degradation
indicated a statistical difference between the data. behavior. It is worth noting that the scaffold was not
completely degraded at 8 weeks; the remaining weight was
3. Results about 50%. This indicated that the scaffold’s stability was
sufficient to provide support for long-term nerve tissue
3.1. Characterization of scaffolds regeneration.
Microfiber bundle-reinforced spinal cord ECM hydrogel
scaffolds loaded with OMT were fabricated by near-field Figure 3B shows the cumulative release curve of OMT.
direct write electrospinning of aligned PCL microfiber OMT can be released continuously from the scaffold, with
Volume 9 Issue 3 (2023) 110 https://doi.org/10.18063/ijb.692