
Page 121 - IJB-9-3
P. 121
International Journal of Bioprinting OMT-loaded spinal cord scaffold
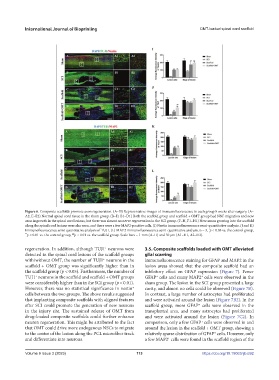
Figure 6. Composite scaffolds promote axon regeneration. (A–H) Representative images of immunofluorescence in each group 8 weeks after surgery. (A–
A2, E–E2) Normal spinal cord tissue in the sham group. (B–D, B1–D1) Both the scaffold group and scaffold + OMT group had NSC migration and new
axon ingrowth in the spinal cord lesions, but there was almost no nerve regeneration in the SCI group. (F–H, F1–H1) New axons growing into the scaffold
along the spinal cord lesions were also seen, and there were a few MAP2-positive cells. (I) Nestin immunofluorescence semi-quantitative analysis. (J and K)
Immunofluorescence semi-quantitative analysis of TUJ1. (L) MAP2 immunofluorescence semi-quantitative analysis. n = 3, p < 0.05 vs. the control group,
*
##
** p < 0.01 vs. the control group, p < 0.01 vs. the scaffold group. Scale bars = 1 mm (A–H) and 50 μm (A1–H1, A2–H2).
regeneration. In addition, although TUJ1 neurons were 3.5. Composite scaffolds loaded with OMT alleviated
+
detected in the spinal cord lesions of the scaffold groups glial scarring
with/without OMT, the number of TUJ1 neurons in the Immunofluorescence staining for GFAP and MAP2 in the
+
scaffold + OMT group was significantly higher than in lesion areas showed that the composite scaffold had an
the scaffold group (p < 0.05). Furthermore, the number of inhibitory effect on GFAP expression (Figure 7). Fewer
TUJ1 neurons in the scaffold and scaffold + OMT groups GFAP cells and many MAP2 cells were observed in the
+
+
+
were considerably higher than in the SCI group (p < 0.01). sham group. The lesion in the SCI group presented a large
However, there was no statistical significance in nestin cavity, and almost no cells could be observed (Figure 7B).
+
cells between the two groups. The above results suggested In contrast, a large number of astrocytes had proliferated
that implanting composite scaffolds with aligned features and were activated around the lesion (Figure 7B2). In the
after SCI could promote the generation of new neurons scaffold group, more GFAP cells were observed in the
+
in the injury site. The sustained release of OMT from transplanted area, and many astrocytes had proliferated
drug-loaded composite scaffolds could further enhance and were activated around the lesion (Figure 7C2). In
neuron regeneration. This might be attributed to the fact comparison, only a few GFAP cells were observed in and
+
that OMT could drive more endogenous NSCs to migrate around the lesion in the scaffold + OMT group, showing a
to the center of the lesion along the PCL microfiber track relatively sparse distribution of GFAP cells. However, only
+
and differentiate into neurons. a few MAP2 cells were found in the scaffold region of the
+
Volume 9 Issue 3 (2023) 113 https://doi.org/10.18063/ijb.692