
Page 270 - IJB-9-3
P. 270
International Journal of Bioprinting Performance of Bredigite-based bone scaffolds
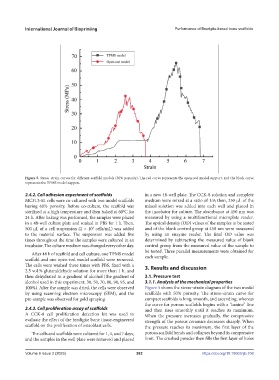
Figure 5. Stress–strain curves for different scaffold models (50% porosity). The red curve represents the open-rod model support, and the black curve
represents the TPMS model support.
2.4.2. Cell adhesion experiment of scaffolds in a new 48-well plate. The CCK-8 solution and complete
MC3T3-E1 cells were co-cultured with two model scaffolds medium were mixed at a ratio of 1:9; then, 250 μL of the
having 60% porosity. Before co-culture, the scaffold was mixed solution was added into each well and placed in
sterilized at a high temperature and then baked at 60°C for the incubator for culture. The absorbance at 450 nm was
24 h. After baking was performed, the samples were placed measured by using a multifunctional microplate reader.
in a 48-well culture plate and soaked in PBS for 1 h. Then, The optical density (OD) values of the samples to be tested
500 μL of a cell suspension (2 × 10 cells/mL) was added and of the blank control group at 450 nm were measured
4
to the material surface. The suspension was added five by using an enzyme reader. The final OD value was
times throughout the time the samples were cultured in an determined by subtracting the measured value of blank
incubator. The culture medium was changed every other day. control group from the measured value of the sample to
be tested. Three parallel measurements were obtained for
After 48 h of scaffold and cell culture, one TPMS model
scaffold and one open-rod model scaffold were removed. each sample.
The cells were washed three times with PBS, fixed with a 3. Results and discussion
2.5 vol.% glutaraldehyde solution for more than 1 h, and
then dehydrated in a gradient of alcohol (the gradient of 3.1. Pressure test
alcohol used in this experiment: 30, 50, 70, 80, 90, 95, and 3.1.1. Analysis of the mechanical properties
100%). After the sample was dried, the cells were observed Figure 5 shows the stress–strain diagram of the two model
by using scanning electron microscopy (SEM), and the scaffolds with 50% porosity. The stress–strain curve for
pre-sample was observed for gold spraying. compact scaffolds is long, smooth, and ascending, whereas
the curve for porous scaffolds begins with a “canine” line
2.4.3. Cell proliferation assay of scaffolds and then rises smoothly until it reaches its maximum.
A CCK-8 cell proliferation detection kit was used to When the pressure increases gradually, the compressive
evaluate the effect of the bredigite bone tissue-engineered strength of the porous ceramics decreases sharply. When
scaffold on the proliferation of osteoblast cells. the pressure reaches its maximum, the first layer of the
The cells and scaffolds were cultured for 1, 4, and 7 days, porous scaffold bends and collapses beyond its compressive
and the samples in the well plate were removed and placed limit. The crushed powder then fills the first layer of holes
Volume 9 Issue 3 (2023) 262 https://doi.org/10.18063/ijb.708