
Page 273 - IJB-9-3
P. 273
International Journal of Bioprinting Performance of Bredigite-based bone scaffolds
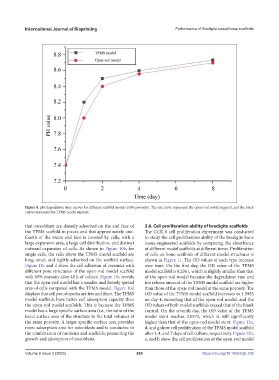
Figure 8. pH-degradation time curves for different scaffold models (50% porosity). The red curve represents the open-rod model support, and the black
curve represents the TPMS model support.
that osteoblasts are densely adsorbed on the end face of 3.6. Cell proliferation ability of bredigite scaffolds
the TPMS scaffold in pieces and that approximately one- The CCK-8 cell proliferation experiment was conducted
fourth of the entire end face is covered by cells, with a to study the cell proliferation ability of the bredigite bone
large expansion area, a large cell distribution, and distinct tissue-engineered scaffolds by comparing the absorbance
outward expansion of cells. As shown in Figure 10b, for of different model scaffolds at different times. Proliferation
single cells, the cells above the TPMS model scaffold are of cells on bone scaffolds of different model structures is
long, stout, and tightly adsorbed on the scaffold surface. shown in Figure 11. The OD values of each type increase
Figure 10c and d show the cell adhesion of ceramics with over time. On the first day, the OD value of the TPMS
different pore structures of the open-rod model scaffold model scaffold is 0.2961, which is slightly smaller than that
with 60% porosity after 48 h of culture. Figure 10c reveals of the open-rod model because the degradation rate and
that the open-rod model has a smaller and loosely spread ion release amount of the TPMS model scaffold are higher
area of cells compared with the TPMS model. Figure 10d than those of the open-rod model at the same porosity. The
displays that cell pseudopodia are few and short. The TPMS OD value of the TPMS model scaffold increases to 1.5953
model scaffolds have better cell adsorption capacity than on day 4, exceeding that of the open-rod model, and the
the open-rod model scaffolds. This is because the TPMS OD values of both model scaffolds exceed that of the blank
model has a large specific surface area (i.e., the ratio of the control. On the seventh day, the OD value of the TPMS
inner surface area of the structure to the total volume) at model stent reaches 2.0573, which is still significantly
the same porosity. A larger specific surface area provides higher than that of the open-rod model stent. Figure 12a,
more adsorption area for osteoblasts and is conducive to d, and g show cell proliferation of the TPMS model scaffold
the combination of nutrients and scaffolds, promoting the after 1, 4, and 7 days of cell culture, respectively. Figure 12b,
growth and adsorption of osteoblasts. e, and h show the cell proliferation of the open-rod model
Volume 9 Issue 3 (2023) 265 https://doi.org/10.18063/ijb.708