
Page 269 - IJB-9-3
P. 269
International Journal of Bioprinting Performance of Bredigite-based bone scaffolds
Table 2. Selected results of porosity of scaffolds with different Table 3. Sample grouping and degradation time
models
Group Degradation time
Model W 0 W 1 W 2 W P P ave 1 2 weeks, 4 weeks, 6 weeks, 8 weeks
T50 2.42 195.32 197.46 2.69 49.09% 50.12% 2 2 weeks, 4 weeks, 6 weeks, 8 weeks
2.4 194.96 197.15 2.63 52.27% 3 2 weeks, 4 weeks, 6 weeks, 8 weeks
2.47 194.58 196.89 2.64 51.51% 4 1 day, 2 days, 4 days, 8 days
T60 1.99 193.3 195.1 2.26 58.69% 59.91%
1.99 192.95 194.75 2.29 61.22% (v) The configured 25 mg/mL protein standard solution
1.96 192.49 194.31 2.17 60.00% (40 μL) was removed and then added to 1960 μL
T70 1.5 194.2 195.63 1.67 70.83% 70.10% of phosphate-buffered saline (PBS) to prepare a
1.54 193.89 195.32 1.78 68.57% standard with a concentration of 0.5 mg/mL. Next,
1.53 193.6 195.01 1.8 69.23% 5 mL of the bicinchoninic acid (BCA) reagent
was added to 100 μL of the BCA reagent, and a
K50 2.39 195.12 197.22 2.69 50.84% 50.37% BCA working solution was obtained by mixing
2.44 194.74 196.98 2.65 51.21% well. Finally, 0, 1, 2, 4, 8, 12, 16, and 20 μL of the
2.34 194.34 196.41 2.6 49.05% standards were added to the 96-well plates, and the
K60 1.98 193.25 195.06 2.23 59.52% 59.52% diluted standard solution was further diluted until
1.98 192 193.83 2.21 60.52% the volume of each standard solution was 20 μL; the
1.94 191.5 193.3 2.16 61.11% diluted concentration was equivalent to 0, 0.025,
K70 1.52 194.18 195.61 1.74 70.96% 70.97% 0.05, 0.1, 0.2, 0.3, 0.4, and 0.5 mg/mL of the standard
concentration.
1.58 194.24 195.78 1.67 69.23%
1.59 194.15 195.78 1.5 69.23% (vi) The four eluents were removed, and 20 μL of these
was added to the 96-well plate. Then, 200 μL of the
BCA working solution was added to each well and
(ii) After incubation, the sample was removed and gently placed in an environment with temperature set at
rinsed three times in sterile water to wash the protein 37°c for 20–30 min. Three parallel holes were created
that was not adsorbed onto the sample. in each of the four samples.
(iii) All samples were placed in a 12-well culture plate (vii) A microplate meter was used to measure the
and eluted with 1% sodium dodecyl sulfate for 1 h.
absorbance at the wavelength of 562 nm. The protein
(iv) The eluent was collected and placed in a centrifugal concentration in the eluent of the sample was then
tube for use (four eluents were used in this study and calculated to determine the protein adsorption
labeled as T1, T2, K1, and K2). capacity of the sample.
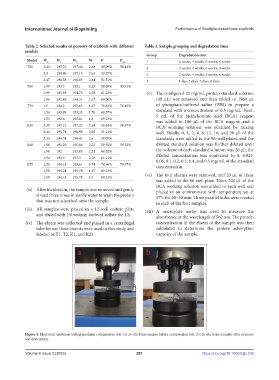
Figure 4. Electronic universal testing machine compression test. (a) In situ bone sample before compression test. (b) In situ bone samples after pressure
test destruction.
Volume 9 Issue 3 (2023) 261 https://doi.org/10.18063/ijb.708