
Page 439 - IJB-9-3
P. 439
International Journal of Bioprinting Gelatin-PVA crosslinked genipin bioinks for skin tissue engineering
The frequency sweep curves of the hydrogels at (Amide I), 1528.35 cm (Amide II), and 1237.43 cm
–1
-1
23°C are shown in Figure 4C and D. The hydrogels were (Amide III). The FTIR spectra of PVA show a broad peak
demonstrated to have G’ modulus greater than G’’ modulus around 3336.2 cm , indicating stretching of hydroxyl
–1
over the entire frequency range, which is indicative of a groups and peaks at 2918.97 cm and 1729.83 cm due
–1
–1
gel-like nature. The value range for G’ modulus was from to C-H stretching. In NC hydrogels that were incorporated
0.000234 ± 0.00083 mPa to 0.00396 ± 0.0037 mPa at a lower with PVA, the spectra reading showed the presence of
frequency (0.1 rad s ), for the following orders: GPVA5_ peak at 3275.78 cm , 3274.15 cm , 3291.70 cm , and
–1
–1
–1
-1
GNP > GPVA3_GNP > GE_NC > GPVA5_NC > GPVA3_ 3292.1 cm in GPVA3_NC, GPVA3_GNP, GPVA5_NC,
–1
NC > GE_GNP, respectively. The GE_GNP showed the and GPVA5_GNP, respectively, indicating the presence of
highest G’ modulus value due to the absence of PVA in hydroxyl group in the hydrogels. The presence of peaks
−1
the hydrogel. This phenomenon occurred due to the PVA below 1000 cm was observed in crosslinked hydrogels,
polymer that literally did not exhibit elastic behavior G’. indicating the formation of intra- and inter-molecular
crosslinking bonds by forming a heterocyclic structure of
Compared to G’, the decrease of G’’ confirms the genipin with primary amine groups. Based on the peaks,
advancement of stiffening and gel formation. The region
where G’ is less than G” suggests that viscosity is dominant,
whereas the region where G’ is more than G” reveals that Table 1. The amount of crystallinity and amorphous level of the
elasticity is dominant due to an extension of hydrophobic hydrogels
interaction . The value of G’’ was higher in GPVA5_GNP Hydrogels Crystallinity (%) Amorphous level (%)
[32]
and GPVA3_GNP (0.0047 ± 0.000030 mPa and 0.00041
± 0.000029 mPa, respectively) as compared to GE_GNP, GE_NC 25.5 74.5
GPVA5_NC, GPVA3_NC, and GE_NC. GE_GNP 29.3 70.7
GPVA3_NC 24.0 76.0
3.5. Chemical characterization GPVA3_GNP 25.3 74.7
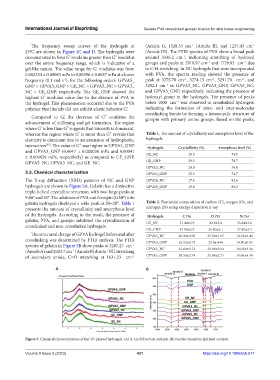
The X-ray diffraction (XRD) patterns of NC and GNP GPVA5_NC 17.4 82.6
hydrogels are shown in Figure 5A. Gelatin has a distinctive GPVA5_GNP 19.8 80.2
triple-helical crystalline structure, with two large peaks at
9.60° and 20°. The addition of PVA and Genipin (GNP) into
gelatin hydrogels displayed a wide peak at 2θ=20°. Table 1 Table 2. Elemental composition of carbon (C), oxygen (O), and
presents the amount of crystallinity and amorphous level nitrogen (N) using energy dispersive x-ray
of the hydrogels. According to the result, the presence of Hydrogels C (%) O (%) N (%)
gelatin, PVA, and genipin inhibited the crystallization of GE_NC 51.40±2.9 22.8±2.4 25.84±3.6
crosslinked and non-crosslinked hydrogels.
GE_GNP 47.83±2.9 24.80±2.1 27.40±3.5
The structural change of GPVA hydrogel before and after GPVA3_NC 60.28±2.05 25.20±1.65 14.52±2.40
crosslinking was determined by FTIR analysis. The FTIR GPVA3_GNP 62.52±0.72 23.0±0.40 14.50±0.85
spectra of gelatin in Figure 5B show peaks at 3287.27 cm
–1
(Amide A) and 2923.7 cm (Amide B) due to -NH stretching GPVA5_NC 61.60±3.12 23.98±2.04 10.02±3.54
–1
of secondary amide, C=O stretching at 1631.23 cm GPVA5_GNP 58.58±3.74 25.88±2.71 15.60±4.34
–1
A B
Figure 5. Chemical characterization of the 3D-printed hydrogels. (A) X-ray diffraction analysis. (B) Fourier transform infrared analysis.
Volume 9 Issue 3 (2023) 431 https://doi.org/10.18063/ijb.677