
Page 441 - IJB-9-3
P. 441
International Journal of Bioprinting Gelatin-PVA crosslinked genipin bioinks for skin tissue engineering
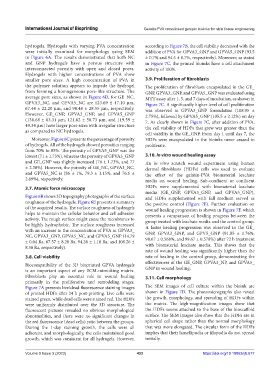
hydrogels. Hydrogels with varying PVA concentration according to Figure 7B, the cell viability decreased with the
were initially examined for morphology using SEM addition of PVA for GPVA3_GNP and GPVA5_GNP (93.5
in Figure 6A. The results demonstrated that both NC ± 0.7% and 94.5 ± 0.7%, respectively). Moreover, as stated
and GNP hydrogels have a porous structure with in Figure 7C, the printed bioinks have a cell attachment
interconnected porosity with open and closed pores. activity of 100%.
Hydrogels with higher concentrations of PVA show
smaller pore sizes. A high concentration of PVA in 3.9. Proliferation of fibroblasts
the polymer solution appears to impede the hydrogel The proliferation of fibroblasts encapsulated in the GE_
from forming a homogeneous pore-like structure. The GNP, GPVA3_GNP, and GPVA5_GNP was evaluated using
average pore sizes, as shown in Figure 6D, for GE_NC, MTT assay after 1, 5, and 7 days of incubation, as shown in
GPVA3_NC, and GPVA5_NC are 123.69 ± 47.10 µm, Figure 7C. A significantly higher level of cell proliferation
67.44 ± 22.20 µm, and 98.48 ± 28.55 µm, respectively. was observed in GPVA3_GNP formulation (108.95 ±
However, GE_GNP, GPVA3_GNP, and GPVA5_GNP 2.75%), followed by GPVA5_GNP (105.5 ± 2.12%) on day
(136.68 ± 63.31 µm, 121.62 ± 58.73 µm, and 119.59 ± 7. As clearly shown in Figure 7C, after addition of PVA,
49.34 µm) have larger pore sizes with irregular structure the cell viability of HDFs that grew was greater than the
as compared to NC hydrogels.
cell viability in the GE_GNP. From day 1 until day 7, the
Moreover, Figure 6C presents the percentage of porosity HDFs were encapsulated in the bioinks never ceased to
of hydrogels. All of the hydrogels showed porosities ranging proliferate.
from 70% to 85%. The porosity of GPVA5_GNP was the
lowest (71 ± 1.73%), whereas the porosity of GPVA3_GNP 3.10. In vitro wound healing assay
and GE_GNP was slightly increased (76 ± 1.73%, and 77 An in vitro scratch wound experiment using human
± 2.30%). However, the porosity of GE_NC, GPVA3_NC, dermal fibroblasts (HDFs) cells was used to evaluate
and GPVA5_NC is (86 ± 1%, 79.3 ± 1.15%, and 76.6 ± the effect of the gelatin-PVA biomaterial leachate
2.89%), respectively. media on wound healing. Sub-confluent or confluent
3.7. Atomic force microscopy HDFs were supplemented with biomaterial leachate
media (GE_GNP, GPVA3_GNP, and GPVA5_GNP),
Figure 6B shows 3D topography photographs of the surface and HDFs supplemented with full medium served as
roughness of the hydrogels. Figure 6E presents a summary the positive control (Figure 7E). Further evaluation on
of the acquired results. The surface roughness of hydrogels wound healing progression is shown in Figure 7F, which
helps to maintain the cellular behavior and cell adhesion presents a comparison of healing progress between the
activity. The rough surface might cause the membranes to group treated with leachate media and the control group.
be highly hydrophobic. The surface roughness increased A faster healing progression was observed in the GE_
with an increase in the concentration of PVA in GPVA3_ GNP, GPVA3_GNP, and GPV5_GNP (91.85 ± 1.76%,
NC, GPVA3_GNP, GPVA5_NC, and GPVA5_GNP (14.79 98.67 ± 0.568%, and 99.67 ± 0.578%) after 72 h treatment
± 0.04 Ra, 67.57 ± 8.20 Ra, 94.26 ± 1.18 Ra, and 108.26 ±
8.58 Ra, respectively). with biomaterial leachate media. This shows that the
rate of wound healing was significantly higher than the
3.8. Cell viability rate of healing in the control group, demonstrating the
Biocompatibility of the 3D bioprinted GPVA hydrogels effectiveness of the GE_GNP, GPVA3_NP, and GPVA5_
is an important aspect of any ECM-mimicking matrix. GNP in wound healing.
Fibroblasts play an essential role in wound healing 3.11. Cell morphology
primarily in the proliferative and remodeling stages.
Figure 7A presents live/dead fluorescence staining images The SEM images of cell culture within the bioink are
of printed HDFs after 24 h post-printing. Live cells were shown in Figure 7D. The photomicrographs also reveal
stained green, while dead cells were stained red. The HDFs the growth, morphology, and spreading of HDFs within
were uniformly distributed over the 3D structure. The the matrix. The high-magnification images show that
fluorescent pictures revealed no obvious morphological the HDFs seems attached to the base of the bioscaffold
abnormalities, and there were no significant changes in surface. The SEM images also show that the HDFs are in
the red fluorescence (dead cells) ratio between the groups. spherical cell shape rather than the normal morphology
During the 1-day staining growth, the cells were all that was more elongated. The circular form of the HDFs
adherent, and morphologically, the cells maintained good implies that their lamellipodia or filopodia do not spread
growth, which was consistent for all hydrogels. However, initially.
Volume 9 Issue 3 (2023) 433 https://doi.org/10.18063/ijb.677