
Page 118 - IJB-9-4
P. 118
International Journal of Bioprinting An inkjet-printed bendable antenna for wearable electronics
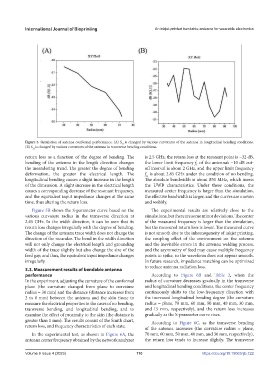
Figure 5. Simulation of antenna conformal performance. (A) S is changed by various curvatures of the antenna in longitudinal bending conditions.
11
(B) S is changed by various curvatures of the antenna in transverse bending conditions.
11
return loss as a function of the degree of bending. The is 2.5 GHz, the return loss at the resonant point is −32 dB,
bending of the antenna in the length direction changes the lower limit frequency f of the antenna’s −10 dB cut-
L
the meandering trend. The greater the degree of bending off interval is about 2 GHz, and the upper limit frequency
deformation, the greater the electrical length. The f is about 2.85 GHz under the condition of no bending.
H
longitudinal bending causes a slight increase in the length The absolute bandwidth is about 850 MHz, which meets
of the dimension. A slight increase in the electrical length the UWB characteristics. Under these conditions, the
causes a corresponding decrease of the resonant frequency, measured center frequency is larger than the simulation,
and the equivalent input impedance changes at the same the effective bandwidth is larger, and the curves are uneven
time, thus altering the return loss. and wobbly.
Figure 5B shows the S-parameter curve based on the The experimental results are relatively close to the
various curvature radius in the transverse direction at simulations, but there are some minor deviations. The center
2.45 GHz. In the width direction, it can be seen that its of the measured frequency is larger than the simulation,
return loss changes irregularly with the degree of bending. but the measured return loss is lower. The measured curve
The change of the antenna trace width does not change the is not smooth due to the inhomogeneity of inkjet printing,
direction of the meander. The bend in the width direction the coupling effect of the environment on the antenna
will not only change the electrical length and grounding and the inevitable errors in the antenna welding process,
width of the trace slightly but also change the size of the and the asymmetry of feed may cause multiple frequency
feed gap, and thus, the equivalent input impedance changes points to spike, so the waveform does not appear smooth.
irregularly. In future research, impedance matching can be optimized
to reduce antenna radiation loss.
3.3. Measurement results of bendable antenna
performance According to Figure 6B and Table 2, when the
In the experiment, adjusting the curvature of the conformal radius of curvature decreases gradually in the transverse
plane (the curvature changed from plane to curvature and longitudinal bending conditions, the center frequency
radius = 30 mm) and the distance (distance increases from continuously shifts to the low-frequency direction with
2 to 8 mm) between the antenna and the skin tissue to the increased longitudinal bending degree (the curvature
measure the electrical properties in the cases of no bending, radius = plane, 70 mm, 60 mm, 50 mm, 40 mm, 30 mm,
transverse bending, and longitudinal bending, and to and 15 mm, respectively), and the return loss increases
examine the effect of proximity to the skin (the distance is gradually as the S-parameter curve rises.
greater than 1 mm). The results consist of the Smith chart, According to Figure 6C, as the transverse bending
return loss, and frequency characteristics of each state. of the antenna increases (the curvature radius = plane,
In the experimental test, as shown in Figure 6A, the 70 mm, 60 mm, 50 mm, 40 mm, and 30 mm, respectively),
antenna center frequency obtained by the network analyzer the return loss tends to increase slightly. The transverse
Volume 9 Issue 4 (2023) 110 https://doi.org/10.18063/ijb.722