
Page 116 - IJB-9-4
P. 116
International Journal of Bioprinting An inkjet-printed bendable antenna for wearable electronics
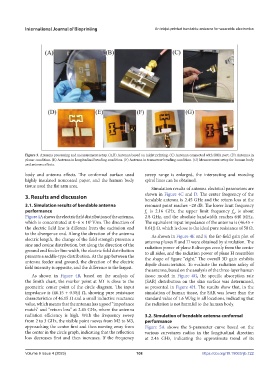
Figure 3. Antenna processing and measurement setup. (A,B) Antenna based on inkjet printing. (C) Antenna connected with SMA port. (D) Antenna in
planar condition. (E) Antenna in longitudinal bending condition. (F) Antenna in transverse bending condition. (G) Measurement setup for human body
and antenna effects.
body and antenna effects. The conformal surface used sweep range is enlarged, the intersecting and receding
highly insulated noncoated paper, and the human body spiral lines can be obtained.
tissue used the flat arm area.
Simulation results of antenna electrical parameters are
3. Results and discussion shown in Figure 4C and D. The center frequency of the
bendable antenna is 2.45 GHz and the return loss at the
3.1. Simulation results of bendable antenna resonant point reaches −28 dB. The lower limit frequency
performance f is 2.16 GHz, the upper limit frequency f is about
H
L
Figure 4A shows the electric field distribution of the antenna, 2.8 GHz, and the absolute bandwidth reaches 640 MHz.
which is concentrated at 0–6 × 10 V/m. The direction of The equivalent input impedance of the antenna is (46.45 +
3
the electric field line is different from the excitation end 0.61j) Ω, which is close to the ideal pure resistance of 50 Ω.
to the divergence end. Along the direction of the antenna As shown in Figure 4E and F, the far-field gain plot of
electric length, the change of the field strength presents a antenna planes E and H were obtained by simulation. The
sine and cosine distribution, but along the direction of the radiation power of plane E diverges evenly from the center
ground and feeder line width, the electric field distribution to all sides, and the radiation power of plane H resembles
presents a saddle-type distribution. At the gap between the the shape of figure “eight.” The overall 3D gain exhibits
antenna feeder and ground, the direction of the electric dipole characteristics. To evaluate the radiation safety of
field intensity is opposite, and the difference is the largest. the antenna, based on the analysis of the three-layer human
As shown in Figure 4B, based on the analysis of tissue model in Figure 4G, the specific absorption rate
the Smith chart, the marker point at M1 is close to the (SAR) distribution on the skin surface was determined,
geometric center point of the circle diagram. The input as presented in Figure 4H. The results show that, in the
impedance is (46.15 + 0.58j) Ω, showing pure resistance simulation of human tissue, the SAR was lower than the
characteristics of 46.15 Ω and a small inductive reactance standard value of 1.6 W/kg in all locations, indicating that
value, which means that the antenna has a good “impedance the radiation is not harmful to the human body.
match” and “return loss” at 2.45 GHz, where the antenna
radiation efficiency is high. With the frequency sweep 3.2. Simulation of bendable antenna conformal
from 2 to 3 GHz, the visible point moves from M2 to M3, performance
approaching the center first and then moving away from Figure 5A shows the S-parameter curve based on the
the center in the circle graph, indicating that the reflection various curvatures radius in the longitudinal direction
loss decreases first and then increases. If the frequency at 2.45 GHz, indicating the approximate trend of its
Volume 9 Issue 4 (2023) 108 https://doi.org/10.18063/ijb.722