
Page 221 - IJB-9-4
P. 221
International Journal of Bioprinting Simulation-based comparative analysis of nozzles for bioprinting
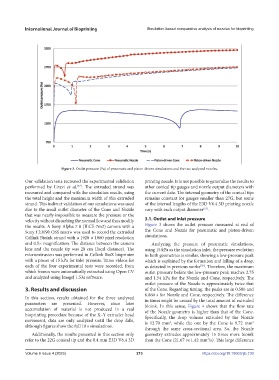
Figure 3. Outlet pressure (Pa) of pneumatic and piston-driven simulations and the two analyzed nozzles.
Our validation tests recreated the experimental validation printing nozzle. It is not possible to generalize the results to
performed by Liravi et al. . The extruded strand was other conical tip gauges and nozzle output diameters with
[47]
measured and compared with the simulation results, using the current data. The internal geometry of the conical tips
the total height and the maximum width of this extruded remains constant for gauges smaller than 27G, but some
strand. This indirect validation of our simulations was used of the internal lengths of the E3D V6.4 3D printing nozzle
due to the small outlet diameter of the Cone and Nozzle vary with each output diameter .
[53]
that was nearly impossible to measure the pressure or the
velocity without disturbing the normal flow and thus modify 3.1. Outlet and inlet pressure
the results. A Sony Alpha 7 ii (ILCE-7m2) camera with a Figure 3 shows the outlet pressure measured at end of
Sony f 2.8/90 OSS macro was used to record the extruded the Cone and Nozzle for pneumatic and piston-driven
Cellink Bioink strand with a 1920 × 1080 pixel resolution simulations.
and 0.5× magnification. The distance between the camera Analyzing the pressure of pneumatic simulations,
lens and the nozzle tip was 28 cm (focal distance). The using 15 kPa as the simulation inlet, the pressure evolution
microextrusion was performed in Cellink BioX bioprinter in both geometries is similar, showing a low-pressure peak
with a preset of 15 kPa for inlet pressure. Three videos for which is explained by the formation and falling of a drop,
each of the four experimental tests were recorded, from as detected in previous works . Therefore, the maximum
[50]
which frames were automatically extracted using Open CV outlet pressure before the low-pressure peak reaches 2.75
and analyzed using ImageJ 1.53e software. and 1.54 kPa for the Nozzle and Cone, respectively. The
outlet pressure of the Nozzle is approximately twice that
3. Results and discussion of the Cone. Regarding timing, the peaks are in 0.586 and
6.860 s for Nozzle and Cone, respectively. The difference
In this section, results obtained for the three analyzed in times might be caused by the total amount of extruded
parameters are presented. However, since later bioink. In this sense, Figure 4 shows that the flow rate
accumulation of material is not produced in a real of the Nozzle geometry is higher than that of the Cone.
bioprinting procedure because of the X–Y extruder head Specifically, the drop volume extruded by the Nozzle
movement, data are only analyzed until the drop falls, is 12.70 mm , while the one by the Cone is 9.72 mm
3
3
although figures show the full 10 s simulations.
through the same cross-sectional area. So, the Nozzle
Additionally, the results presented in this section only geometry extrudes approximately 15 times more bioink
refer to the 22G conical tip and the 0.4 mm E3D V6.4 3D than the Cone (21.67 vs 1.42 mm /s). This large difference
3
Volume 9 Issue 4 (2023) 213 https://doi.org/10.18063/ijb.730