
Page 220 - IJB-9-4
P. 220
International Journal of Bioprinting Simulation-based comparative analysis of nozzles for bioprinting
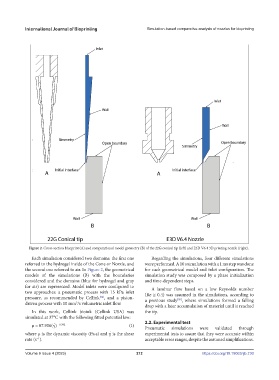
Figure 2. Cross-section blueprint (A) and computational model geometry (B) of the 22G conical tip (left) and E3D V6.4 3D printing nozzle (right).
Each simulation considered two domains: the first one Regarding the simulations, four different simulations
referred to the hydrogel inside of the Cone or Nozzle, and were performed. A 10 s simulation with a 1 ms step was done
the second one referred to air. In Figure 2, the geometrical for each geometrical model and inlet configuration. The
models of the simulations (B) with the boundaries simulation study was composed by a phase initialization
considered and the domains (blue for hydrogel and gray and time-dependent steps.
for air) are represented. Model inlets were configured to A laminar flow based on a low Reynolds number
two approaches: a pneumatic process with 15 kPa inlet (Re ≅ 0.4) was assumed in the simulations, according to
pressure, as recommended by Cellink , and a piston- a previous study , where simulations formed a falling
[54]
[50]
driven process with 10 mm /s volumetric inlet flow.
3
drop with a later accumulation of material until it reached
In this work, Cellink bioink (Cellink USA) was the tip.
simulated at 37°C with the following fitted potential law:
2.2. Experimental test
μ = 87.906(γ˙) -0.792 (I)
Pneumatic simulations were validated through
where μ is the dynamic viscosity (Pa·s) and γ˙ is the shear experimental tests to assure that they were accurate within
rate (s ). acceptable error ranges, despite the assumed simplifications.
−1
Volume 9 Issue 4 (2023) 212 https://doi.org/10.18063/ijb.730