
Page 223 - IJB-9-4
P. 223
International Journal of Bioprinting Simulation-based comparative analysis of nozzles for bioprinting
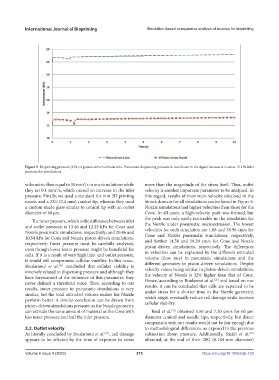
Figure 5. Dispensing pressure (kPa) of piston-driven simulations. Pneumatic dispensing pressure is not shown in the figure because it is set as 15 kPa inlet
pressure for simulations.
3
volumetric flow equal to 10 mm /s in our simulations while more than the magnitude of the stress itself. Thus, outlet
3
they set 0.1 mm /s, which caused an increase in the inlet velocity is another important parameter to be analyzed. In
pressure. Finally, we used a standard 0.4 mm 3D printing this regard, results of maximum velocity obtained in the
nozzle and a 22G (0.4 mm) conical tip, whereas they used bioink domain for all simulations can be found in Figure 6.
a custom-made glass similar to conical tip with an outlet Nozzle simulations had higher velocities than those for the
diameter of 60 µm. Cone. In all cases, a high-velocity peak was formed, but
The inner pressure, which is the difference between inlet the peak was only easily noticeable in the simulation for
and outlet pressure, is 13.46 and 12.25 kPa for Cone and the Nozzle under pneumatic microextrusion. The lowest
Nozzle pneumatic simulations, respectively; and 20.46 and velocities for each simulation are 1.88 and 38.96 cm/s for
10.54 kPa for Cone and Nozzle piston-driven simulations, Cone and Nozzle pneumatic simulations, respectively,
respectively. Inner pressure must be carefully analyzed, and further 14.50 and 19.20 cm/s for Cone and Nozzle
even though lower inner pressure might be beneficial for piston-driven simulations, respectively. The differences
cells. If it is a result of very high inlet and outlet pressure, in velocities can be explained by the different extruded
it would still compromise cellular viability. In this sense, volume (flow rate) in pneumatic simulations and the
Boularaoui et al. concluded that cellular viability is different geometry in piston-driven simulations. Despite
[26]
inversely related to dispensing pressure and although they velocity values being similar in piston-driven simulations,
have forewarned of the influence of this parameter, they the velocity of Nozzle is 32% higher than that of Cone.
[26]
never defined a threshold value. Thus, according to our Hence, according to Boularoui at al. and based on our
results, inner pressure in pneumatic simulations is very results, it can be concluded that cells are expected to be
similar, but the total extruded volume makes the Nozzle under stress for a shorter time in the Nozzle geometry,
perform better. A similar conclusion can be drawn from which might eventually reduce cell damage while increase
piston-driven simulations pressure, as the Nozzle geometry cellular viability.
can extrude the same amount of material as the Cone with Reid et al. obtained 5.50 and 7.20 cm/s for 60 μm
[42]
less inner pressure and half the inlet pressure. diameter conical and needle tips, respectively, but direct
comparison with our results would not be fair enough due
3.2. Outlet velocity to methodological differences, as exposed in the previous
As literally concluded by Boularaoui et al. [26] , cell damage subsection about pressure. Additionally, Smith et al.
[45]
appears to be affected by the time of exposure to stress obtained, at the end of their 28G (0.184 mm diameter)
Volume 9 Issue 4 (2023) 215 https://doi.org/10.18063/ijb.730