
Page 285 - IJB-9-4
P. 285
International Journal of Bioprinting 3D printing of continuous fiber reinforced PLA/PGA composites
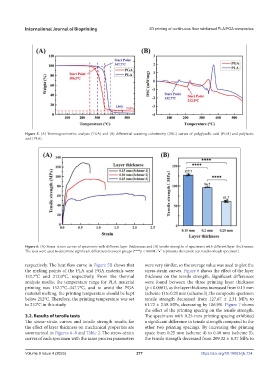
Figure 5. (A) Thermogravimetric analysis (TGA) and (B) differential scanning calorimetry (DSC) curves of polyglycolic acid (PGA) and polylactic
acid (PLA).
Figure 6. (A) Stress–strain curves of specimens with different layer thicknesses and (B) tensile strengths of specimens with different layer thicknesses.
The tests were used to determine significant differences between groups (****p < 0.0001; “•” represents the tensile test results of each specimen).
respectively. The heat flow curve in Figure 5B shows that were very similar, so the average value was used to plot the
the melting points of the PLA and PGA materials were stress-strain curves. Figure 6 shows the effect of the layer
152.7°C and 212.0°C, respectively. From the thermal thickness on the tensile strength. Significant differences
analysis results, the temperature range for PLA material were found between the three printing layer thickness
printing was 152.7°C–347.7°C, and to avoid the PGA (p < 0.0001), as the layer thickness increased from 0.15 mm
material melting, the printing temperature should be kept (scheme 1) to 0.25 mm (scheme 3), the composite specimen
below 212°C. Therefore, the printing temperature was set tensile strength decreased from 127.67 ± 2.31 MPa to
to 210°C in this study. 61.72 ± 2.58 MPa, decreasing by 106.9%. Figure 7 shows
the effect of the printing spacing on the tensile strength.
3.2. Results of tensile tests The specimens with 0.25-mm printing spacing exhibited
The stress–strain curves and tensile strength results for a significant difference in tensile strength compared to the
the effect of layer thickness on mechanical properties are other two printing spacings. By increasing the printing
summarized in Figures 6–8 and Table 2. The stress–strain space from 0.25 mm (scheme 4) to 0.40 mm (scheme 5),
curves of each specimen with the same process parameters the tensile strength decreased from 209.32 ± 8.37 MPa to
Volume 9 Issue 4 (2023) 277 https://doi.org/10.18063/ijb.734