
Page 290 - IJB-9-4
P. 290
International Journal of Bioprinting 3D printing of continuous fiber reinforced PLA/PGA composites
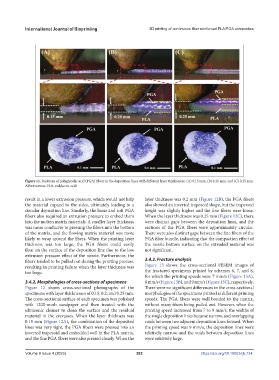
Figure 11. Positions of polyglycolic acid (PGA) fibers in the deposition lines with different layer thicknesses. (A) 0.15 mm, (B) 0.20 mm, and (C) 0.25 mm.
Abbreviation: PLA, polylactic acid.
result in a lower extrusion pressure, which would not help layer thickness was 0.2 mm (Figure 12B), the PGA fibers
the material expand to the sides, ultimately leading to a also showed an inverted trapezoid shape, but the trapezoid
circular deposition line. Similarly, the loose and soft PGA height was slightly higher and the fine fibers were loose.
fibers also required an extrusion pressure to embed them When the layer thickness was 0.25 mm (Figure 12C), there
into the molten matrix materials. A smaller layer thickness were distinct gaps between the deposition lines, and the
was more conducive to pressing the fibers into the bottom sections of the PGA fibers were approximately circular.
of the matrix, and the flowing matrix material was more There were also distinct gaps between the fine fibers of the
likely to wrap around the fibers. When the printing layer PGA fiber bundle, indicating that the compaction effect of
thickness was too large, the PGA fibers could easily the nozzle bottom surface on the extruded material was
float on the surface of the deposition line due to the low not significant.
extrusion pressure effect of the nozzle. Furthermore, the
fibers tended to be pulled out during the printing process, 3.4.3. Fracture analysis
resulting in printing failure when the layer thickness was Figure 13 shows the cross-sectional FESEM images of
too large. the fractured specimens printed by schemes 6, 7, and 8,
for which the printing speeds were 7 mm/s (Figure 13A),
3.4.2. Morphologies of cross-sections of specimens 8 mm/s (Figure 13B), and 9 mm/s (Figure 13C), respectively.
Figure 12 shows cross-sectional photographs of the There were no significant differences in the cross-sectional
specimens with layer thicknesses of 0.15, 0.2, and 0.25 mm. morphologies of the specimens printed at different printing
The cross-sectional surface of each specimen was polished speeds. The PGA fibers were well bonded to the matrix,
with 1200-mesh sandpaper and then treated with the without many fibers being pulled out. However, when the
ultrasonic cleaner to clean the surface and the residual printing speed increased from 7 to 9 mm/s, the widths of
material in the crevasses. When the layer thickness was the single deposition lines became narrow, and overlapping
0.15 mm (Figure 12A), the combination of the deposited voids between two adjacent deposition lines formed. When
lines was very tight, the PGA fibers were pressed into an the printing speed was 9 mm/s, the deposition lines were
inverted trapezoid and embedded well in the PLA matrix, relatively narrow, and the voids between deposition lines
and the fine PGA fibers were also pressed closely. When the were relatively large.
Volume 9 Issue 4 (2023) 282 https://doi.org/10.18063/ijb.734