
Page 289 - IJB-9-4
P. 289
International Journal of Bioprinting 3D printing of continuous fiber reinforced PLA/PGA composites
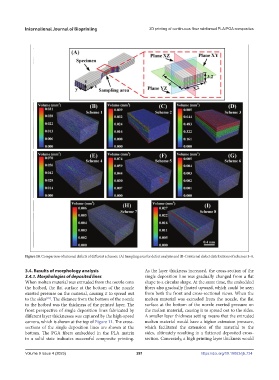
Figure 10. Comparison of internal defects of different schemes. (A) Sampling area for defect analysis and (B–I) internal defect distributions of schemes 1–8.
3.4. Results of morphology analysis As the layer thickness increased, the cross-section of the
3.4.1. Morphologies of deposited lines single deposition line was gradually changed from a flat
When molten material was extruded from the nozzle onto shape to a circular shape. At the same time, the embedded
the hotbed, the flat surface at the bottom of the nozzle fibers also gradually floated upward, which could be seen
exerted pressure on the material, causing it to spread out from both the front and cross-sectional views. When the
to the sides . The distance from the bottom of the nozzle molten material was extruded from the nozzle, the flat
[21]
to the hotbed was the thickness of the printed layer. The surface at the bottom of the nozzle exerted pressure on
front perspective of single deposition lines fabricated by the molten material, causing it to spread out to the sides.
different layer thicknesses was captured by the high-speed A smaller layer thickness setting means that the extruded
camera, which is shown at the top of Figure 11. The cross- molten material would have a higher extrusion pressure,
sections of the single deposition lines are shown at the which facilitated the extension of the material to the
bottom. The PGA fibers embedded in the PLA matrix sides, ultimately resulting in a flattened deposited cross-
in a solid state indicates successful composite printing. section. Conversely, a high printing layer thickness would
Volume 9 Issue 4 (2023) 281 https://doi.org/10.18063/ijb.734