
Page 291 - IJB-9-4
P. 291
International Journal of Bioprinting 3D printing of continuous fiber reinforced PLA/PGA composites
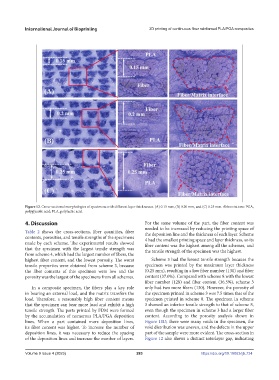
Figure 12. Cross-sectional morphologies of specimens with different layer thicknesses. (A) 0.15 mm, (B) 0.20 mm, and (C) 0.25 mm. Abbreviations: PGA,
polyglycolic acid; PLA, polylactic acid.
4. Discussion For the same volume of the part, the fiber content was
needed to be increased by reducing the printing space of
Table 2 shows the cross-sections, fiber quantities, fiber the deposition line and the thickness of each layer. Scheme
contents, porosities, and tensile strengths of the specimens 4 had the smallest printing space and layer thickness, so its
made by each scheme. The experimental results showed fiber content was the highest among all the schemes, and
that the specimen with the largest tensile strength was the tensile strength of the specimen was the highest.
from scheme 4, which had the largest number of fibers, the
highest fiber content, and the lowest porosity. The worst Scheme 3 had the lowest tensile strength because the
tensile properties were obtained from scheme 3, because specimen was printed by the maximum layer thickness
the fiber contents of this specimen were low and the (0.25 mm), resulting in a low fiber number (130) and fiber
porosity was the largest of the specimens from all schemes. content (37.0%). Compared with scheme 8 with the lowest
fiber number (128) and fiber content (36.5%), scheme 3
In a composite specimen, the fibers play a key role only had two more fibers (130). However, the porosity of
in bearing an external load, and the matrix transfers the the specimen printed in scheme 3 was 7.5 times that of the
load. Therefore, a reasonably high fiber content means specimen printed in scheme 8. The specimen in scheme
that the specimen can bear more load and exhibit a high 3 showed an inferior tensile strength to that of scheme 8,
tensile strength. The parts printed by FDM were formed even though the specimen in scheme 3 had a larger fiber
by the accumulation of numerous PLA/PGA deposition content. According to the porosity analysis shown in
lines. When a part contained more deposition lines, Figure 10D, there were many voids in the specimen, the
its fiber content was higher. To increase the number of void distribution was uneven, and the defects in the upper
deposition lines, it was necessary to reduce the spacing part of the sample were more evident. The cross-section in
of the deposition lines and increase the number of layers. Figure 12 also shows a distinct interlayer gap, indicating
Volume 9 Issue 4 (2023) 283 https://doi.org/10.18063/ijb.734