
Page 288 - IJB-9-4
P. 288
International Journal of Bioprinting 3D printing of continuous fiber reinforced PLA/PGA composites
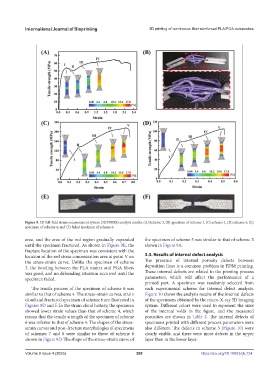
Figure 9. 3D full-field strain measurement system (3DFFSMS) analysis results. (A) Scheme 3, (B) specimen of scheme 3, (C) scheme 4, (D) scheme 6, (E)
specimen of scheme 4, and (F) failed specimen of scheme 6.
area, and the area of the red region gradually expanded the specimen of scheme 5 was similar to that of scheme 3
until the specimen fractured. As shown in Figure 9E, the shown in Figure 9A.
fracture location of the specimen was consistent with the
location of the red stress concentration area at point V on 3.3. Results of internal defect analysis
the stress-strain curve. Unlike the specimen of scheme The presence of internal porosity defects between
3, the bonding between the PLA matrix and PGA fibers deposition lines is a common problem in FDM printing.
was good, and no debonding situation occurred until the These internal defects are related to the printing process
specimen failed. parameters, which will affect the performance of a
printed part. A specimen was randomly selected from
The tensile process of the specimen of scheme 6 was each experimental scheme for internal defect analysis.
similar to that of scheme 4. The stress–strain curves, strain Figure 10 shows the analysis results of the internal defects
cloud and fractured specimen of scheme 6 are illustrated in of the specimens obtained by the micro-X-ray 3D imaging
Figures 9D and F. In the strain cloud history, the specimen system. Different colors were used to represent the sizes
showed lower strain values than that of scheme 4, which of the internal voids in the figure, and the measured
means that the tensile strength of the specimen of scheme porosities are shown in Table 2. The internal defects of
6 was inferior to that of scheme 4. The shapes of the stress- specimens printed with different process parameters were
strain curves and post-fracture morphologies of specimens also different. The defects in scheme 3 (Figure 10) were
of schemes 7 and 8 were similar to those of scheme 6 clearly visible, and there were more defects in the upper
shown in Figure 9D. The shape of the stress–strain curve of layer than in the lower layer.
Volume 9 Issue 4 (2023) 280 https://doi.org/10.18063/ijb.734