
Page 42 - IJB-9-4
P. 42
International Journal of Bioprinting 3D-Bioprinted human lipoaspirate-derived cell-laden skin constructs
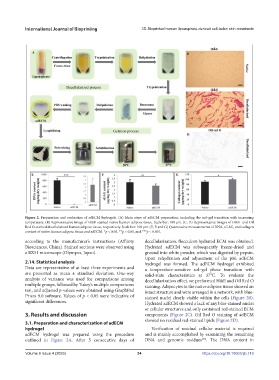
Figure 2. Preparation and evaluation of adECM hydrogels. (A) Main steps of adECM preparation, including the sol–gel transition with increasing
temperature. (B) Representative image of H&E-stained native human adipose tissue. Scale bar: 100 μm. (C, D) Representative images of H&E- and Oil
Red O-stained decellularized human adipose tissue, respectively. Scale bar: 100 μm. (E, F, and G) Quantitative measurements of DNA, sGAG, and collagen
content of native human adipose tissue and adECM. *p < 0.05, **p < 0.01, and ***p < 0.001.
according to the manufacturer’s instructions (Affinity decellularization, flocculent-hydrated ECM was obtained.
Biosciences, China). Stained sections were observed using Hydrated adECM was subsequently freeze-dried and
a BX51 microscope (Olympus, Japan). ground into white powder, which was digested by pepsin.
Upon rehydration and adjustment of the pH, adECM
2.14. Statistical analysis hydrogel was formed. The adECM hydrogel exhibited
Data are representative of at least three experiments and a temperature-sensitive sol–gel phase transition with
are presented as mean ± standard deviation. One-way solid-state characteristics at 37°C. To evaluate the
analysis of variance was used for comparisons among decellularization effect, we performed H&E and Oil Red O
multiple groups, followed by Tukey’s multiple comparisons staining. Adipocytes in the native adipose tissue showed an
test, and adjusted p-values were obtained using GraphPad intact structure and were arranged in a network, with blue-
Prism 9.0 software. Values of p < 0.05 were indicative of stained nuclei clearly visible within the cells (Figure 2B).
significant differences. Hydrated adECM showed a lack of any blue-stained nuclei
or cellular structures and only contained red-stained ECM
3. Results and discussion components (Figure 2C). Oil Red O staining of adECM
showed no residual red-stained lipids (Figure 2D).
3.1. Preparation and characterization of adECM
hydrogel Verification of residual cellular material is required
adECM hydrogel was prepared using the procedure and is mainly accomplished by examining the remaining
[36]
outlined in Figure 2A. After 5 consecutive days of DNA and genomic residues . The DNA content in
Volume 9 Issue 4 (2023) 34 https://doi.org/10.18063/ijb.718