
Page 420 - IJB-9-5
P. 420
International Journal of Bioprinting 3D-printed Mg scaffolds promote bone defect repair
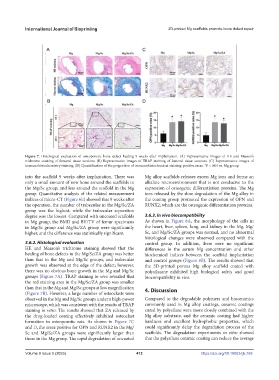
Figure 7. Histological evaluation of osteoporotic bone defect healing 9 weeks after implantation. (A) Representative images of HE and Masson’s
trichrome staining of femoral tissue sections. (B) Representative images of TRAP staining of femoral tissue sections. (C) Representative images of
immunohistochemistry staining. (D) Quantification of the proportion of immunohistochemical staining-positive areas. *P < 0.05 vs. Mg group.
into the scaffold 9 weeks after implantation. There was Mg alloy scaffolds releases excess Mg ions and forms an
only a small amount of new bone around the scaffolds in alkaline microenvironment that is not conducive to the
the Mg/Sc group, and less around the scaffold in the Mg expression of osteogenic differentiation proteins. The Mg
group. Quantitative analysis of the related measurement ions released by the slow degradation of the Mg alloy in
indices of micro-CT (Figure 6E) showed that 9 weeks after the coating group promoted the expression of OPN and
the operation, the number of trabeculae in the Mg/Sc/ZA RUNX2, which are the osteogenic differentiation proteins.
group was the highest, while the trabecular separation
degree was the lowest. Compared with uncoated scaffolds 3.6.3. In vivo biocompatibility
in Mg group, the BMD and BV/TV of femur specimens As shown in Figure 8A, the morphology of the cells in
in Mg/Sc group and Mg/Sc/ZA group were significantly the heart, liver, spleen, lung, and kidney in the Mg, Mg/
higher, and the difference was statistically significant. Sc, and Mg/Sc/ZA groups was normal, and no abnormal
histological changes were observed compared with the
3.6.2. Histological evaluation control group. In addition, there were no significant
HE and Masson’s trichrome staining showed that the differences in the serum Mg concentration and other
healing of bone defects in the Mg/Sc/ZA group was better biochemical indices between the scaffold implantation
than that in the Mg and Mg/Sc groups, and trabecular and control groups (Figure 8B). The results showed that
growth was observed at the edge of the defect; however, the 3D-printed porous Mg alloy scaffold coated with
there was no obvious bone growth in the Mg and Mg/Sc polysilazane exhibited high biological safety and good
groups (Figure 7A). TRAP staining in vivo revealed that biocompatibility in vivo.
the red staining area in the Mg/Sc/ZA group was smaller
than that in the Mg and Mg/Sc groups at low magnification 4. Discussion
(Figure 7B). However, a large number of osteoclasts were
observed in the Mg and Mg/Sc groups under a high-power Compared to the degradable polymers and bioceramics
microscope, which was consistent with the results of TRAP commonly used in Mg alloy coatings, ceramic coatings
staining in vitro. The results showed that ZA released by cured by polysilane were more closely combined with the
the drug-loaded coating effectively inhibited osteoclast Mg alloy substrate, and the ceramic coating had higher
formation in osteoporotic rats. As shown in Figure 7C hardness and excellent hydrophobic properties, which
and D, the areas positive for OPN and RUNX2 in the Mg/ could significantly delay the degradation process of the
Sc and Mg/Sc/ZA groups were significantly larger than scaffolds. The degradation experiments in vitro showed
those in the Mg group. The rapid degradation of uncoated that the polysilane ceramic coating can reduce the average
Volume 9 Issue 5 (2023) 412 https://doi.org/10.18063/ijb.769